Subscribe to Our Newsletter
Hear more from Equity Methods: Your trusted partner in equity compensation excellence.
At many companies, design season for 2017 annual grants is closing. Meanwhile, ISS has published their voting guidelines, and a new administration in Washington has given us quite a lot to chew on. Here are our predictions for how compensation will change in 2017.
Total shareholder return (TSR) designs have become incredibly popular in the last few years. According to most surveys (we like the NASPP/Deloitte 2016 Domestic Stock Plan Survey), over 50% of companies use TSR.
There are good reasons for TSR’s popularity. The metric, with its direct alignment to shareholder value creation, helps correct pay-for-performance disconnects in a way that non-TSR awards can’t. Issuers also can set TSR metrics on a relative basis, avoiding the goal-setting difficulties of financial and operational metrics.
At the same time, TSR has come under fire. To executives, line of sight on a metric like TSR can be unclear. On top of that, outcomes can depend more on starting and ending points than on sustained value creation, especially when the performance period is only three years. As a result, TSR can fall short of compensation committee expectations that equity grants do more to drive behavior.
We think these concerns explain the soaring use of “hybrid” awards that combine TSR with one or more financial or operational metrics. By our count, more than half the companies issuing TSR awards make them part of a hybrid award. That number has steadily climbed for the last few years. And there are many different ways to structure a hybrid award, such as using TSR as a modifier or giving each metric independent weightings.
Our prediction: By 2020, over 75% of TSR designs will be of the hybrid variety.
Additional Resources:
ISS’ stance has traditionally been that TSR is the most appropriate method for pay-for-performance assessments. Glass Lewis, on the other hand, has already explored other measures in their pay-for-performance analysis. For this and other reasons, users and preparers of financial statements have urged ISS to consider metrics beyond TSR.
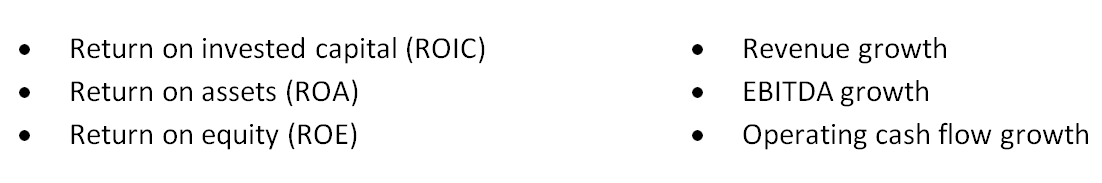
For 2017, ISS will keep their quantitative screening methodology—which looks only at TSR—the same, but they will alter their qualitative evaluation procedures. Specifically, ISS’ qualitative evaluation will look at six financial metrics:
In principle, we like the idea of adding a more holistic set of considerations to any qualitative assessment. But where is this headed? These metrics are not surefire predictors of outperformance.
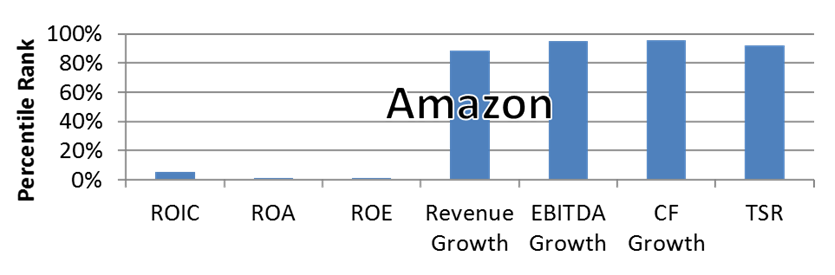
For example, we modeled TSR plus the six financial metrics for a few different companies. We wanted to see how each tells a pay-for-performance story. In the case of Amazon, we saw exceptional growth, low return ratios, but high TSR (see Figure 1).
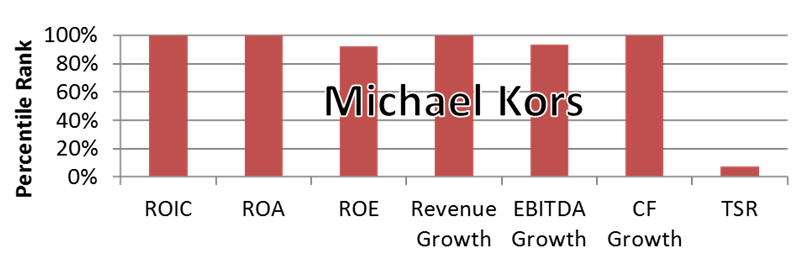
By contrast, for Michael Kors we modeled solid financial ratios across the board but low TSR (see Figure 2).
In short, adding metrics is easy. The hard part is deciphering which ones are most meaningful and why. This is the holy grail in the investment management space, so it’s tough to be optimistic that ISS or any other proxy advisor will crack the nut.
Our prediction: ISS’ quantitative screen will remain TSR-focused, but companies will continue trying to tell a story in their proxy that may extend beyond just TSR.
Additional Resources:
Companies like financial and operational metrics because they are concrete and deliver greater line of sight. Much for the same reason, there’s a natural preference for these metrics to span shorter periods. According to Equilar research that covers 2015 proxy data, 18.5% of companies use performance periods of only one year. We think this number is understated, as cases involving three one-year metrics that are modified by a three-year TSR metric get counted as a three-year award.
While appealing to companies, one-year performance periods are wildly unpopular with ISS, who claims that performance periods shorter than three years are essentially short-term incentive plans masquerading as long-term ones. We expect to see mounting pressure to use a performance period no shorter than three years anywhere in the long-term plan.
To be clear, there are extremely valid reasons for performance periods that are shorter than three years. For example, macroeconomic turmoil could systematically shatter incentives, leaving companies that have longer performance periods with the equivalent of underwater options to deal with.
Our best advice is to carefully review your goal-setting capabilities and tools. Stress-test them to see whether it’s realistic to set goals three years into the future. If you can, do it, because this will likely become even more of a hot button for governance. Otherwise, consider using TSR as a modifier or some other means to reinforce that your awards reward long-run performance.
Our prediction: By 2020, 90% of awards will have performance periods of three or more years.
Additional Resources:
Executive compensation gets more scrutiny than ever. Emphasis on paying for performance is as strong as ever. And the age of data-driven decision-making is in full swing. All three of these trends come together when setting goals for performance awards based on financial or operational metrics.
Most companies continue to use internal forecasts for setting a target, since these typically have the most detailed and relevant information. But how should they adjust those targets to arrive at threshold and stretch goals? And for that matter, how can everyone believe that the target goal is reasonable?
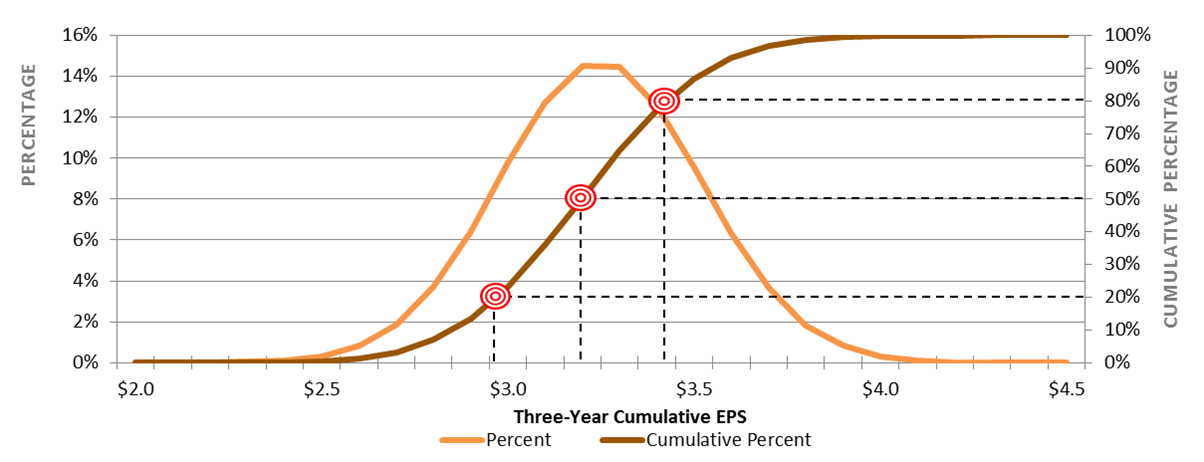
Increasingly, the response is to turn to data. More specifically, you can collect analyst estimates, gather historical outcomes for you and your peers, or even build a simulation model to construct a distribution of possible outcomes (see Figure 3).
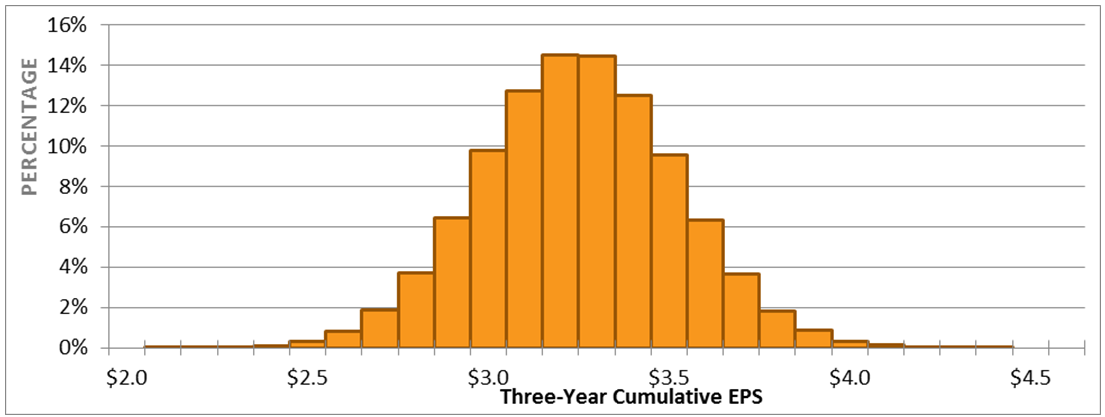
The data gathered can then be used to infer threshold, target, and stretch goals. If we assume a rule of thumb that threshold goals should be 80% probable, targets 50% probable, and stretch goals 20% probable, we can pick out those points on the distribution and get the corresponding levels of performance (see Figure 4).
Of course, no analysis should take place in a vacuum. The baseline remains the internal forecast, and then this sort of data analysis represents corroborating evidence for the goals. But no amount of modeling or forecasting can replace good human judgment. A robust goal-setting process requires melding the quantitative with the qualitative.
Our prediction: By 2020, goal rigor will be one of the top three topics in shareholder outreach and proxy voting decisions.
Additional Resources:
Seven years into Dodd-Frank—but currently only months into our new political administration—the question looms: What is the destiny of this regulation that has changed the game for executive compensation?
As we discuss in The Destiny of Dodd-Frank’s Executive Compensation Provisions, we see a scalpel rather than a sledgehammer applied to Dodd-Frank. Widespread repeal is unlikely to garner adequate bipartisan support.
Our predictions are that:
Additional Resources: