Subscribe to Our Newsletter
Hear more from Equity Methods: Your trusted partner in equity compensation excellence.
It’s hard to talk about corporate strategy without the conversation quickly turning to artificial intelligence. Despite all the hype and confusion surrounding AI, there seems little doubt that AI will reshape entire industries and create new cohorts of winners and losers.
Other technologies have done the same thing. However, AI seems to be doing it quicker, more broadly, and to a greater extreme relative to what we’ve seen in the past. Unlike previous disruptions that swept entire sectors, AI is also forging new fault lines within sub-industries.
This has startling implications for executive compensation and, more specifically, stock-based compensation (SBC). AI is poised to eliminate existing business models while unlocking new ones. That’s a challenge for traditional SBC programs that reward short-term operational performance or general market participation. The next generation of SBC will likely need to encourage sub-industry leadership, proactive AI adoption, and business model preservation (and adaptation).
In this article, we’ll explore a blueprint for how to rethink SBC design in the context of potential disruption and opportunity from AI. We’ll start by sharing some research on how this disruption is already manifesting in security prices. Then we’ll pivot to some of the strategies forward-thinking boards and management teams are considering in the face of change.
“While AI holds immense future promise, it is no panacea; companies with outdated technology and operations will struggle to realize its benefits. The future lies in their ability to adapt their operations and business models at speed, or risk being disrupted by more agile competitors.”[1]
“It’s kind of interesting in a market…where we feel the [Magnificent 7 high-performing tech stocks] have been truly correlated. Now the market is saying, ‘Wait, hold on. We might start to see diverging performance.’”[2]
“When software as a service (SaaS) first emerged 25 years ago, it revolutionized software by moving it to the cloud and speeding up feature delivery. Now, a fresh discontinuity is at hand.”[3]
“These developments are expected to shake up the economic foundations of finance, affecting billions in revenue and posing a threat to business models…Pioneers willing to lead the way could see a game-changing upside, while those who don’t innovate will lose out.”[4]
In years past, we noted an uptick in stock price correlations, which suggested returns were overly driven by macroeconomic effects. The rise in index investing exacerbated these effects. That’s now changing.
Correlations among peers are declining. A semiconductor designer leveraging generative AI for chip optimization might surge ahead, while a legacy player in the same sub-industry that clings to outdated fabs will fall behind. This intra-sub-industry divergence is evident in the S&P 500. There, AI-forward firms are posting median three-year total shareholder returns (TSRs) of 112%, compared to just 24% for their non-AI counterparts in the same niches.
This article draws on a comprehensive analysis of three-year TSR, volatility, and beta, as well as trailing twelve-month (TTM) revenue growth and EBITDA margin.
To quantify AI’s disruption already, we studied the performance of S&P 500 companies from September 2022 to September 2025. This roughly corresponds to the first three years following ChatGPT’s debut, marking a unique period when the allure of AI suddenly became quite real.[5]
Our approach was to identify companies that were AI-forward and compare them with peers that were lagging. That way, we could see how AI was creating winners and losers among tightly knit cohorts of companies. We refer to this as the AI decoupling effect.
We began by classifying each of the 503 tickers in the S&P 500 by their Global Industry Classification Standard (GICS) sub-industry. Then, for each sub-industry with at least four firms (98 sub-industries in all), we calculated an AI score per company. The score combined two criteria:
For the first criterion, we counted mentions across the prepared remarks, Q&A, and analyst questions. (The assumption is that management’s public references to AI are a leading indicator of investment.) The second criterion is an estimate based on 10-K filings and analyst reports.
We calculated the scores for each metric, then weighted them equally. Companies in the top half of each sub-industry were deemed AI-leading and the bottom half were AI-lagging.
These are imperfect proxies because commentary during an earnings call could just be spin, and AI-linked revenue is backward-looking. However, there’s a credible deterrent to excessive spin and a mix of leading and lagging indicators lend balance to the overall score.
Aggregate performance across the S&P 500 reveals how proactive AI adoption is reshaping competitive dynamics, with AI-forward firms surging ahead within their sub-industries.
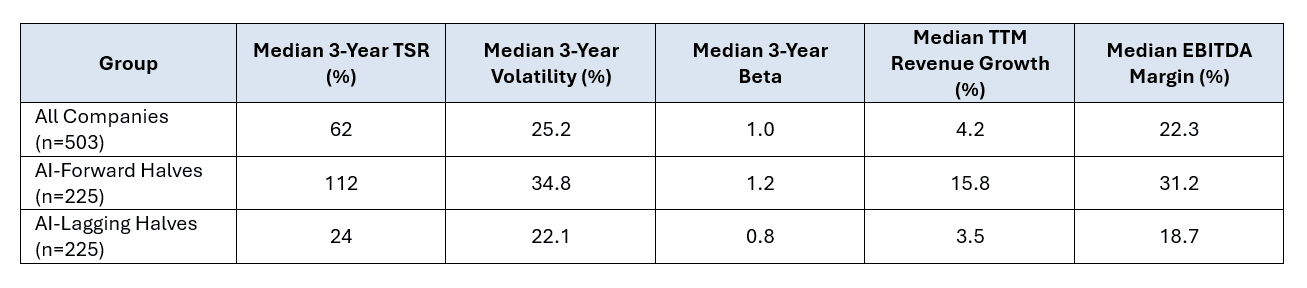
Table 1: S&P 500 Split by AI-Forward and AI-Lagging Firms
These splits reveal how proactive AI adoption is reshaping competitive dynamics, with AI-forward firms surging ahead within their sub-industries.
An 88% TSR spread, 12.3% revenue growth rate spread, and 12.5% EBITDA margin spread speak for themselves. The higher volatility and beta of the AI-forward firms further indicate decoupling. From 2019–2022 (pre-AI boom), betas across sub-industries were relatively uniform and higher overall. This reflected a market where companies moved in tighter sync, driven by shared macro forces like the pandemic recovery or low rates. As you can see in Table 1, betas now diverge, as AI-forward companies are decoupling upward while the laggards experience isolation from upside.
If every company is a tech company, as the adage goes, then it’s reasonable to expect AI’s impact to reverberate well beyond the tech industry. Let’s zoom in on the results for semiconductors, diversified banks, and integrated oil and gas.
The S&P 500 semiconductor industry consists of 12 firms, including giants like NVIDIA (which is why it’s important to report medians and not averages). The AI-forward companies boast a median TSR of 385% while the laggards have a median TSR of 68% (Table 2).
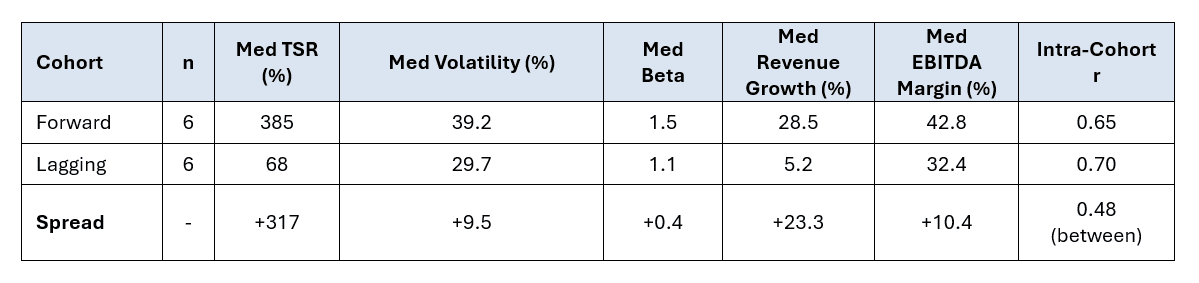
Table 2: S&P 500 Semiconductor Firms Split by AI-Forward and AI-Lagging
You might be wondering what the 0.48 correlation refers to. This is a measure of the correlation of daily returns between AI-forward and AI-laggard companies. A correlation of 1.0 would mean they move completely in lockstep, and a correlation of 0 would mean they have no association. The 0.48 correlation is down from 0.70 pre-2022, suggesting the semiconductor cohort is splitting apart.
In banking, AI is driving innovation in areas like fraud detection and personalized lending strategies. Of the 10 companies in the diversified banks sub-industry, we again have two equal cohorts of leaders and laggards.

Table 3: S&P 500 Financial Services Diversified Banks Split by AI-Forward and AI-Lagging
We see the same story playing out with a material difference in TSRs between cohorts. The returns correlation is also quite low at 0.59, which is down from 0.78 pre-2022.
In the oil and gas industry—where AI is used for seismic modeling, predictive drilling, and emissions tracking—AI-forward players have a median TSR of 48% as compared to AI laggards with median TSR of only 20%. A correlation of 0.52 is also well below the pre-2022 level of 0.75.

Table 4: S&P 500 Integrated Oil and Gas Firms Split by AI-Forward and AI-Lagging
Here it’s especially interesting to see the AI leaders delivering higher returns with lower volatility, which represents a unicorn outcome to shareholders.
Across all these examples, AI is creating sub-industry islands with AI-forward firms decoupling from their broader cohort.
Compensation needs to reflect and enable business strategy. If CEOs and boards are worried about being disrupted by AI, then pay must specifically drive the activities needed to be an AI-forward organization.
Below we share some ideas on how compensation can support AI modernization strategies. But first, let’s look at the types of metrics you can choose from.
Metrics can be leading or lagging, which is to say they can measure inputs and outputs. We think both are important. The most lagging or output-linked metric is TSR, which answers the question of whether the potpourri of initiatives are showing up in valuation.
On the other end, you have leading indicator metrics which tell you if you’re pointed in the right direction. These deliver higher line of sight to recipients and more immediate data to management as to whether the strategy is on track. The downside to a leading indicator metric is that it may or may not be correlated with shareholder value creation, since it’s functionally a bet that X, Y, and Z activities will necessarily show up in the form of a higher stock price.
We believe we’ll see an uptick in strategic and operational metrics linked to AI adoption. We don’t expect to see this become a majority practice due to goal-setting complexity and even the potential for disclosure to cause competitive harm. Nevertheless, many boards believe the risks of falling behind are too high to simply rely on lagging indicators.
Metric selection and goal-setting are never easy, but they’re even harder with strategic and operational metrics where it’s unclear what “good” looks like. These issues are more acute for equity awards where modifications and exercises of discretion can have problematic consequences.
There’s generally more flexibility to pick creative metrics for the annual plan since these get reset annually and are supposed to have a more operational feel to them. For the long-term incentive plan, we might see metrics such as:
Any metric that’s AI-linked can be ambiguous as to what truly qualifies. Governance is critical to counter internal incentives to slap the AI label on too many things. We’d encourage companies to start building their tracking and review processes now.
Finally, it’s worth noting that these problems are neither novel nor specific to compensation. Goal-setting and tracking of key metrics are important regardless of what they’re linked to. Recall companies’ use of e-commerce goals in the 1990s and what it took to link these goals to revenue and cost savings. Ditto with the onset of mobile less than a decade later.
In short, when dealing with leading indicators, the fog of war is inevitable. Expect to update and remeasure them.
Generally, it’s better to place tough-to-measure goals in the short-term plan since they can be updated more frequently and modified without major accounting consequences. The catch, of course, is that those goals are also less material to the overall pay package.
In our experience, strategic metrics are less commonly seen in the LTIP. But when they are, the signal they send is very strong. If AI adoption is of existential importance to your company, we encourage you to find some way to fold AI goals into your LTIP.
One potential compromise is to condition equity grants on AI hurdles. Depending on the structure, this can have complex accounting implications (namely, a service inception date that precedes the grant date). However, it provides a way to include one-year goals with an otherwise three-year instrument.
Almost 80% of S&P 500 companies use relative TSR metrics in one form or another. While the stand-alone vs. modifier debate is important, an equally important question is what sort of peer group to use. Our research here suggests that boards may take interest in narrower peer groups to hone in on sub-industry disruptions. The optimal peer group is one that’s large enough to avoid idiosyncratic shocks from specific companies but small enough to enable like-for-like comparisons.
Without over-generalizing, we think this often points to the use of sub-industry peer groups that consist of 20 to 50 peers instead of hundreds. Our research shows 74% of TSR variance now stems from sub-industry dynamics, not sector tides.[6] This suggests winners and losers will exist in every sector, and the decoupling will occur intra-sector.
On the other hand, there’s an appeal to comparing against the broader market. In a pure apples-to-apples comparison, a maximum payout requires being the best apple in the bunch, instead of benefiting from having some sour grapefruit in a more diverse basket of fruit. We note this to emphasize that while AI is introducing disruption at the sub-industry level, there are certainly more considerations than only this that go into LTI design.
Think of it this way: AI has implications for the future of entire industries. But in the intermediate term (e.g., five to 10 years), new winners and losers will be created within industries before they’re created across industries. Some software firms will be vertically integrated out of existence by firms that today are neck-and-neck rivals or unknown disruptors.
AI’s sub-industry schisms, manifesting through lower correlations and winner-take-all TSR outcomes, aren’t slowing. They’re accelerating.
To be sure, compensation isn’t the only lever for navigating organizational change and the innovator’s dilemma. But if the business strategy is increasingly rallying around AI leadership, how AI-linked metrics should find their way into both the annual plan and LTIP is worth serious consideration.
At Equity Methods, we help companies in all facets of program design. We partner with clients on creative incentive design structures, cost modeling, accounting and proxy implications, and more. Don’t hesitate to reach out if you would like to discuss this further.
****************************************************
[1] Burak Kiral et al., “Farewell, SaaS: AI is the future of enterprise software,” AlixPartners, May 29, 2025, https://www.alixpartners.com/insights/102kcw9/farewell-saas-ai-is-the-future-of-enterprise-software/.
[2] Chamath Palihapitiya et al., “How AI Can Supercharge GDP and Bring Down Costs in the Medical Field,” All-In Podcast, June 21, 2025, https://www.youtube.com/watch?v=86t6YNf_B7Q.
[3] David Crawford et al., “Will Agentic AI Disrupt SaaS?” Bain & Company, July 2025,
https://www.bain.com/insights/will-agentic-ai-disrupt-saas/.
[4] Ramji Sundararajan, Uzayr Jeenah, and Alana Ellis, “The end of inertia: Agentic AI’s disruption of retail and SME banking,” McKinsey & Company, August 15, 2025.
[5] Similarly, we studied the three-year period prior to September 2022 to measure financial performance and data prior to ChatGPT’s forceful market debut.
[6] We used a variance decomposition, which essentially breaks down the differences in companies’ three-year TSRs using regression modeling to measure how much of the differences come from broad sector trends versus specific sub-industry factors. The punchline is that AI is fracturing competition at a granular level as opposed to simply buoying and depressing overall sectors.
