Subscribe to Our Newsletter
Hear more from Equity Methods: Your trusted partner in equity compensation excellence.
Every year, we collect the proxy data from S&P 500 companies and reconcile these trends with our own on-the-ground experience helping companies design their long-term incentive plans (LTIPs). In this blog post, we take inventory of the trends unfolding in executive compensation and our predictions for what we’ll see in 2022.
As of this writing, most calendar-year companies have formalized the core components of their 2022 LTIP designs. They’ll fine-tune the remaining details between now and their intended grant dates in February or March. In this blog, we’ll share practical last-minute tips to consider when finalizing your LTIP as well as predictions to watch for throughout the year.
Specifically, we’ll cover four emerging trends:
1. Growing adoption of relative performance awards
2. Increasing reliance on sector-based comparison groups when issuing relative awards
3. A surge in the issuance of executive mega grants
4. The onset of ESG metrics in annual and long-term incentive plans
We’ll wrap by exploring several trends—capital efficiency metrics, post-vest holding periods, and lengthier performance periods—that we predicted would take hold, but didn’t.
It’s no surprise that economic uncertainty remains extremely high. Supply chain disruptions, labor force participation, and Covid’s staying power make long-range revenue and earnings forecasting extremely difficult. Academics model these phenomena that we practitioners experience first hand. For example, the Federal Reserve of Atlanta, in collaboration with Stanford and the University of Chicago, publishes the Survey of Business Uncertainty.
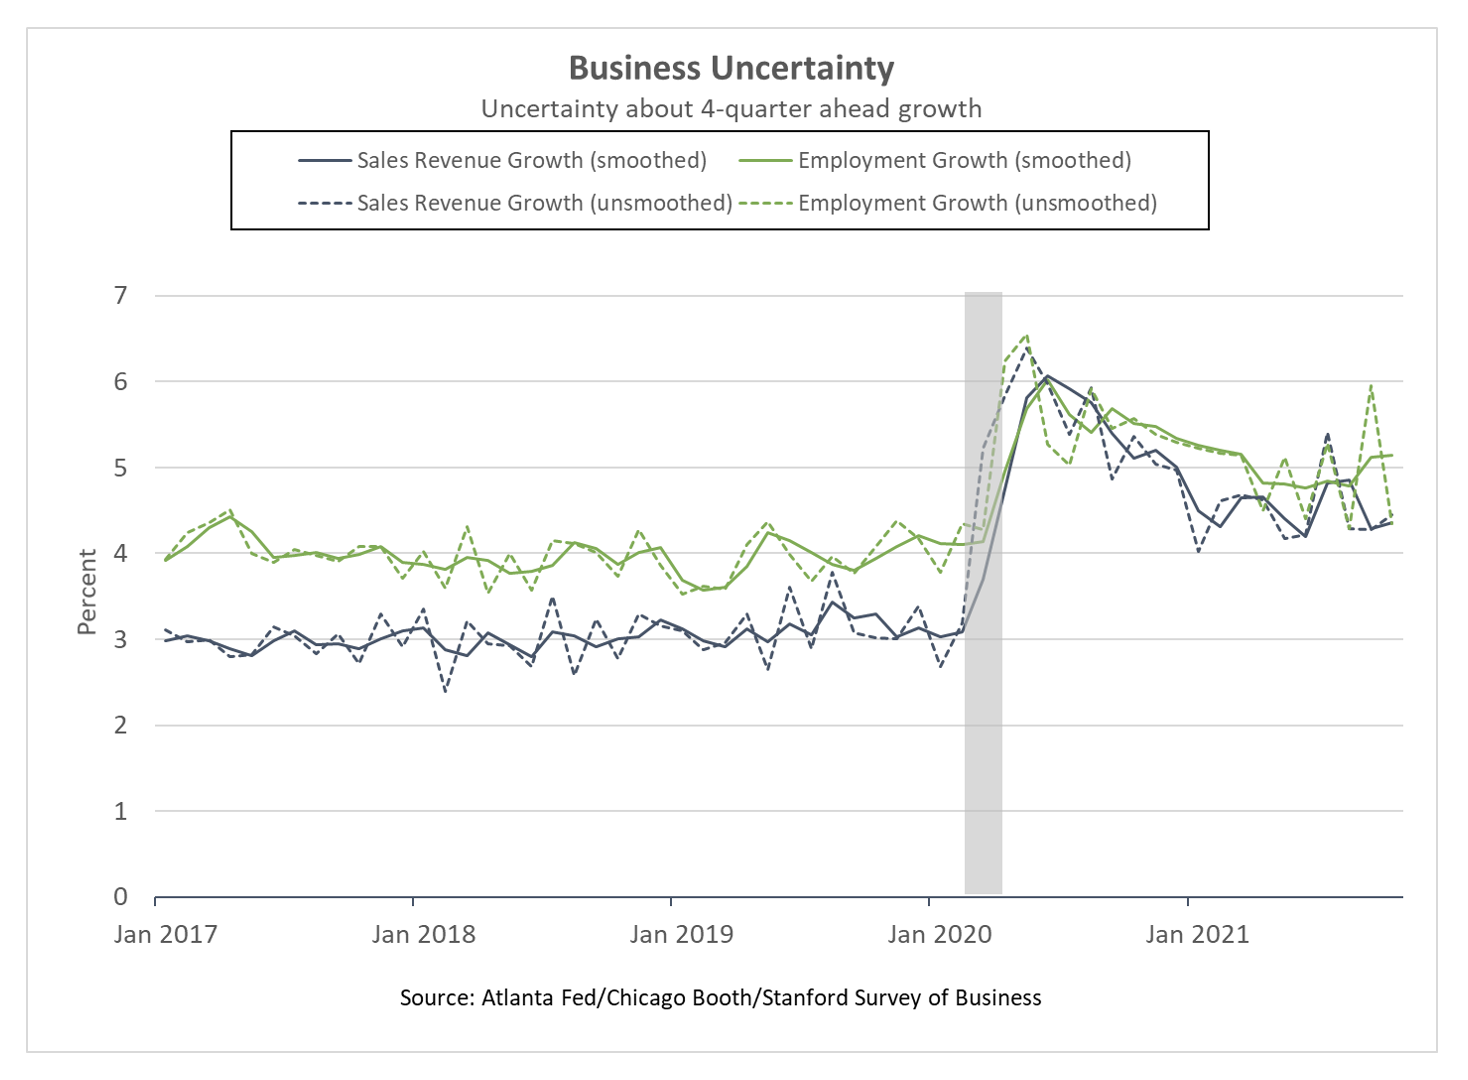
Figure 1: Business Uncertainty, January 2017-January 2021
As Figure 1 shows, we’re certainly facing less uncertainty than in the second quarter of 2020 when Covid blasted onto the world stage. But we’re far from any sense of normality—especially when focusing on the revenue trend line.
Relative performance metrics are designed to filter out macroeconomic “noise” so that performance is measured according to factors that executives can control. While far from perfect, the trend we’re seeing is a clear ongoing expansion to include relative metrics in the LTIP.
This is what’s showing up in the data. Comparing 2021 proxy data to 2020 data, 72% of S&P 500 companies now use relative total shareholder return (rTSR) in some capacity in their LTIP. Over 30 companies, or 7% of the S&P 500, added rTSR in 2021. Only two companies dropped it.
Relative stock price metrics tend to work better than relative financial metrics, but we’re also seeing steady growth in the latter. These could take the form of relative earnings growth, relative return on capital, or any other number of variations. In spite of some of the challenges with relative financial metrics that we’ve discussed, 22% of S&P 500 companies utilize one.
Relative financial metric prevalence varies tremendously by sector (Figure 2 below). We don’t think we’ll see this number double, since absolute company-specific financial goals will always have a place. But especially during periods of uncertainty, we might see an uptick in the use of relative financial metric modifiers to help counteract the goal-setting ambiguity.
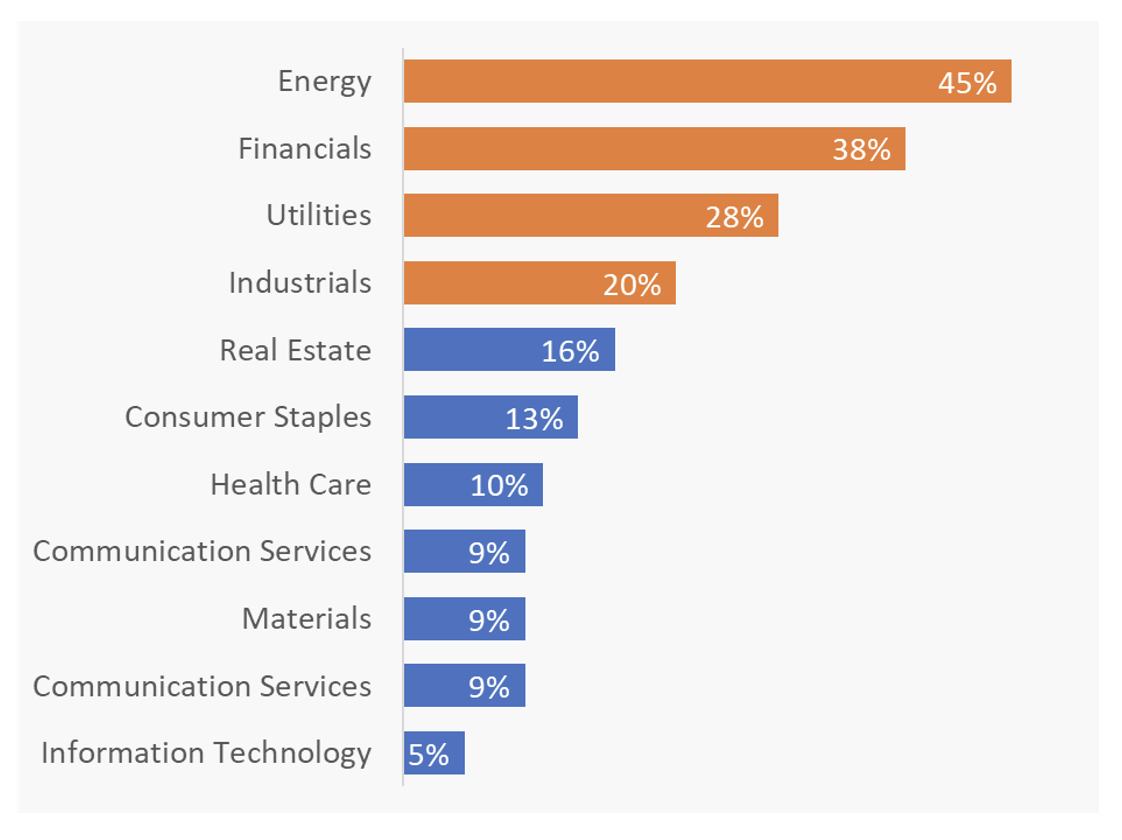
Figure 2: Use of Relative Financial Metrics by Sector
Insofar as relative performance awards are on the rise, much more thought is going into their design. Indeed, much of the criticism of relative performance equity is about flawed design constructs rather than the idea of basing pay on relative performance.
The size and composition of the comparison group is a key variable. Make the comparison group too large and you end up benchmarking against irrelevant firms that have substantially different business cycles and economic tailwinds or headwinds. Make the comparison group too small and you may end up with large award payout differences that stem from minor performance differences.
Here’s why this matters: Shareholders can enter and exit stock positions anytime they want, but executives receive LTIP grants only once a year, and only with strictly defined performance start and end dates. These take the form of point-to-point comparisons, such as measuring performance from January 1, 2022 to December 31, 2024 (albeit with customary averaging periods at each point). Benchmarking against firms in a different industry which might be at a low or high point relative to your own industry inserts a bias. That bias defeats the entire purpose of issuing a relative performance award, which is to filter out economic noise that is beyond management’s control.
Let’s look at an example. The following chart plots the relative performance of technology, financial, and energy firms in 2020 both within their own sectors and in the overall market.
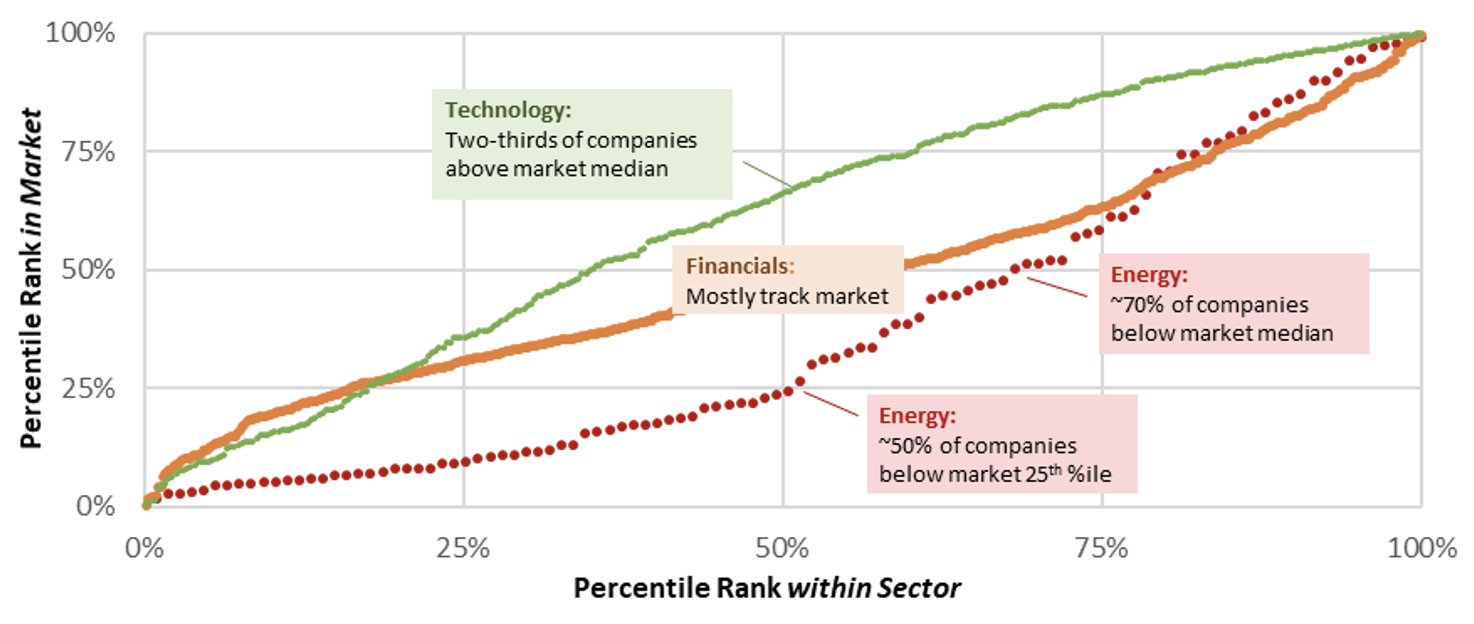
Figure 3: Relative Performance of Technology, Financial, and Energy Firms in 2020
Probably to no one’s surprise, technology led the way in 2020 while energy brought up the rear. Imagine being an energy company and having your TSR or earnings compared to that of Zoom or Peloton or DoorDash or any other firm that thrived during the pandemic.
But the story is a bit more nuanced than that. This chart shows how sector performance stacked up in 2021:
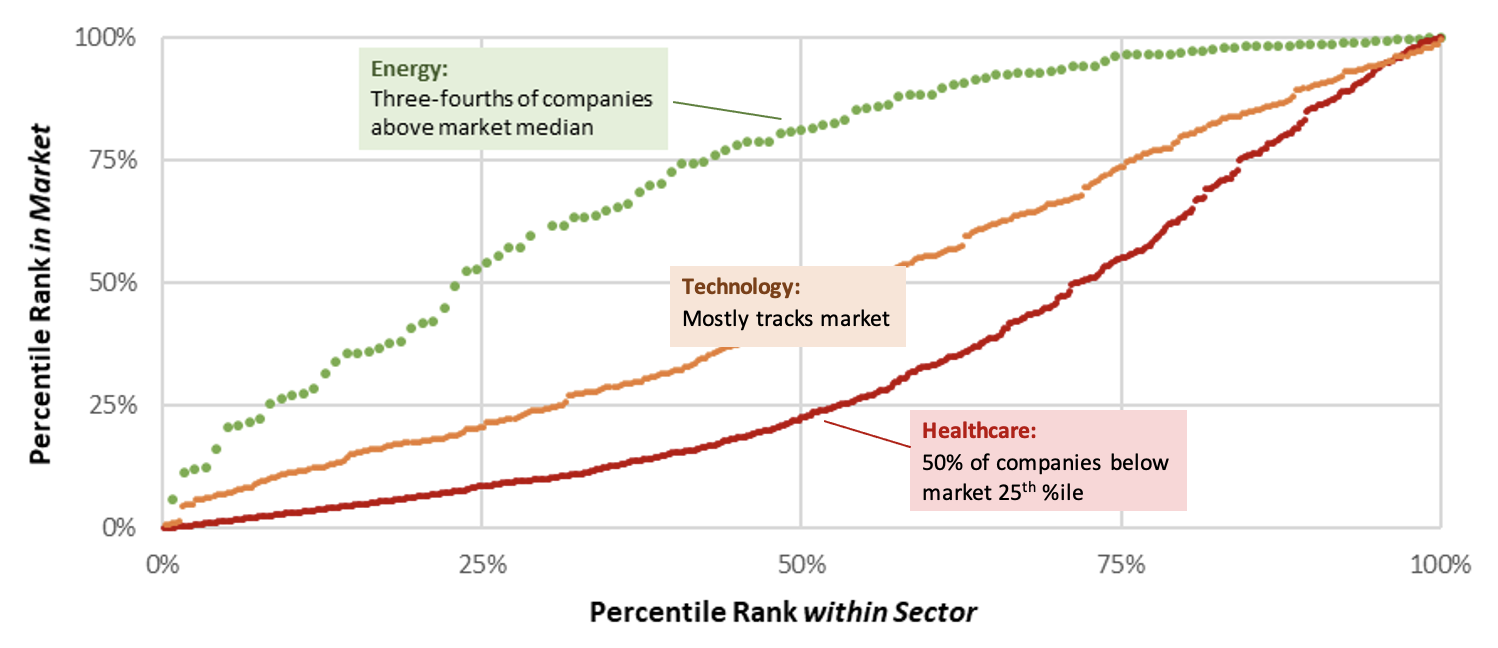
Figure 4: Relative Performance of Technology, Financial, and Energy Firms in 2021
Strangely, energy has led the way in 2021 and healthcare has brought up the rear (after having been a strong performer in 2020). If an energy company granted a relative TSR award in 2020 and benchmarked against the S&P 500, it would actually realize an artificial positive bias by starting the performance measurement at a low point for the sector (the abyss of 2020).
Let’s take a look at the LTIP trends unfolding. The following chart shows the prevalence of using a custom peer group, a broad-based market index, and a sector index. Note how broad market groups are gradually becoming less prevalent.
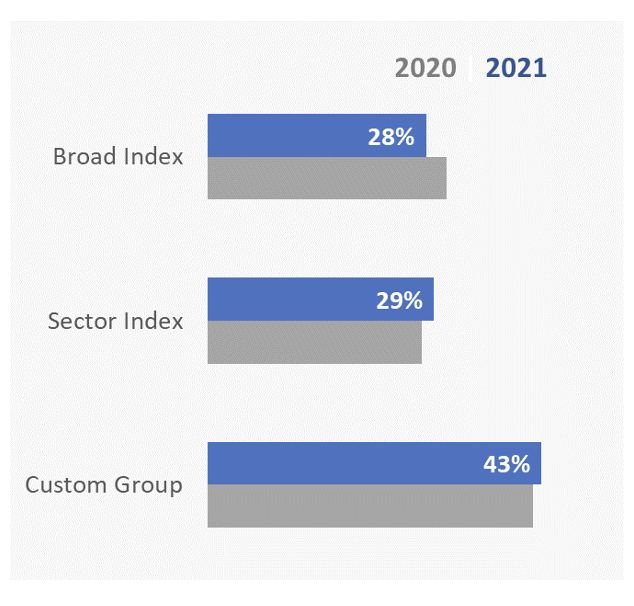
Figure 5: Prevalence of Using a Custom Group, Sector Index, and Broad Index
We expect to see a gradual increase in the use of sector-specific comparison groups. Broad market indices will always have a place, and may make particular sense for extremely large organizations that track the general market. But for most companies, it’s important to ensure that comparisons occur against similar organizations within their sector.
What about using the compensation peer group? Here you need to be careful to avoid establishing too small of a comparison group. To show how circumstances can result in a nonsensical payout, here’s an extreme example featuring 10 peers:
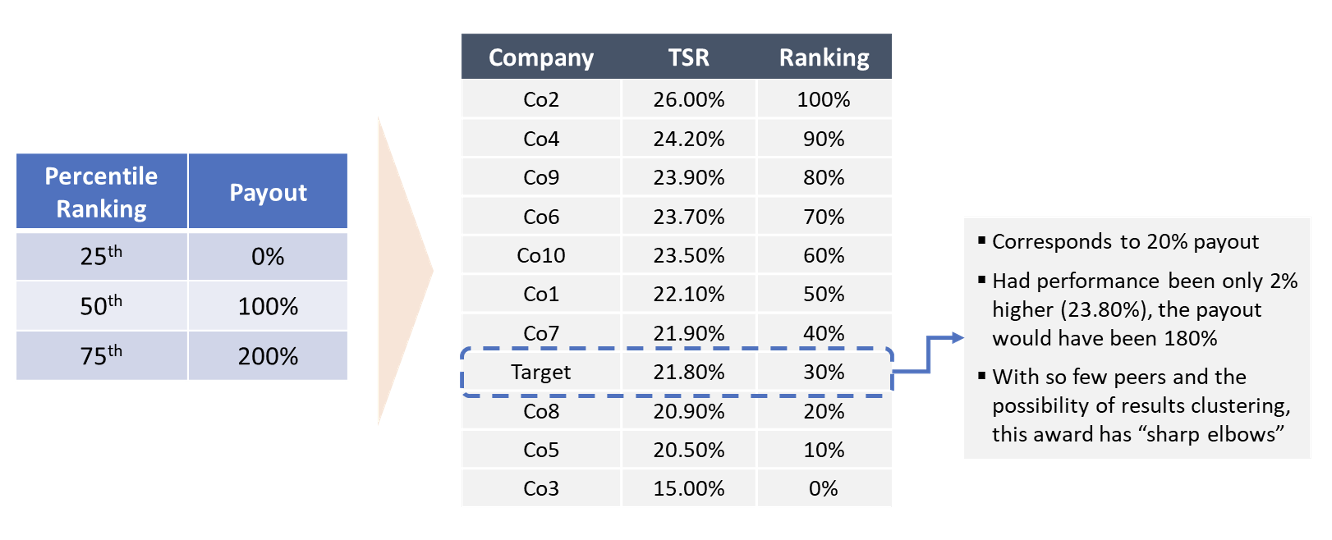
Figure 6: An Effect of Using a Too-Small Comparison Group
This example may be hypothetical, but it’s not unusual when dealing with a small peer group. As you can see, most of the peers’ returns are tightly clustered. Except for the top-ranking and bottom-ranking firm, the rest of the returns are insignificantly different. However, these insignificant differences in shareholder returns translate to large payout differences.
Net-net: Goldilocks peer groups are the emerging best practice—not too large, not too small.
Executive mega grants have exploded in both size and frequency. Let’s take a quick stroll down memory lane.
Mega grants aren’t new. In 2014, Microsoft awarded Satya Nadella a one-time performance-based equity award valued at approximately $59 million. The award would be earned over a seven-year period and was intended to create an upfront alignment of incentives and a material amount of unvested equity as Nadella transitioned into his new CEO role. Spread over its term, the award had an annualized value of roughly $8.4 million. Nadella would also receive annual refresh grants in the neighborhood of $13 million per year.
A few years earlier, in August 2011, Apple granted Tim Cook an outsized RSU award with a five and 10-year vesting schedule. The total RSU value was $376 million, roughly equating to an annualized amount of $37 million per year. It was entirely time vesting. In fact, Apple wrote in its proxy that the “Board’s determination of the amount of the RSU award was subjective. There was no formula or peer group ‘benchmark’ used in determining the award amount. Rather, the award was the product of the Board’s business judgment…”
Then there’s the Tesla mega grant—well, actually, two of them. The first was in 2012 and amounted to $78 million of disclosed value. The second was in 2018 at a whopping $2.83 billion in value. Incidentally, the media has had some interesting coverage of the 2012 grant as it nears its expiration.
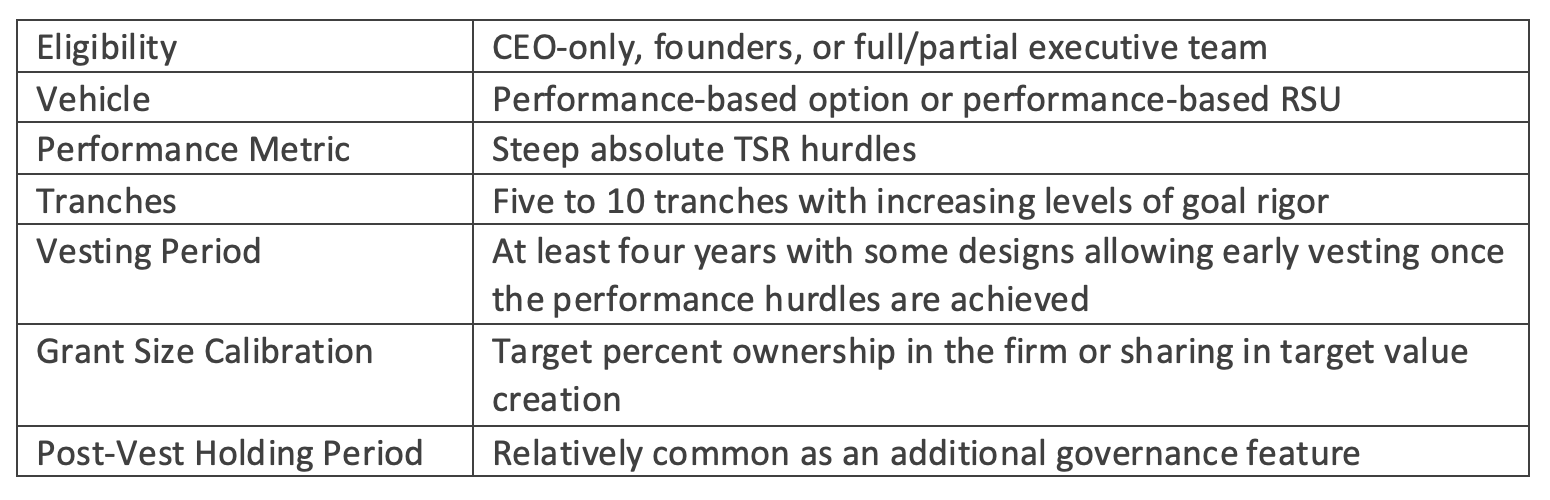
Now, fast forward to 2020 and 2021. During these last two years, approximately 10% of S&P 500 companies have made some form of outsized grant. We’ve been involved in designing and accounting for dozens of these and covered them in prior publications. The circumstances behind an executive mega grant tend to concern one or more of the following factors:
The number of S&P 500 companies that have made mega grants is not so surprising, as normal governance pressures put a ceiling on just how prevalent this practice can become. What’s interesting is the prevalence of these and related granting practices outside the S&P 500—in particular, pre-IPO and newly public companies.[1] The red-hot labor market in these spaces is creating unprecedented disruption among larger companies that have more regimented equity practices.
In this regard, mega grants aren’t just for CEOs any longer. Our experience is that after the CEO receives their outsized award, they want to put some or all of the key leadership team onto the same incentive structure to drive alignment.
We expect to see a steady uptick, especially outside the S&P 500, in creative granting practices that deliver high upside potential for extremely high value creation. Although these instruments vary in design, most tend to have the following attributes:
The accounting for mega grants is relatively standard with the complexity being linked to the upfront valuation and treatment of the many different award terms. One interesting twist we’ve seen recently is the GO Award, in which the hefty payout upside only kicks in at financial performance levels that are in excess of target. As a result, the target pay disclosed in the proxy does not factor in the hefty upside, though it is disclosed as a footnote in the proxy and would ordinarily be covered in the narrative given the overall salience of the mega grant.
Plan for more creative awards, those with high upside pay in reward for high shareholder value creation. Measure twice and cut once, both when designing these packages and informally accounting for them in the financial statements and proxy.
Environmental, social, and governance (ESG) issues have come under shareholder scrutiny, in large part due to the growing influence of passive institutional investors whose only recourse is the proxy vote. Unlike active investors, passive funds cannot buy and sell the stock to create reward and demerits. Instead, they cast votes on directors, say on pay, and externally submitted proposals in the proxy.
With ESG now a foundational priority, it’s only natural for boards and shareholders to think, “If this is really so important, why isn’t it influencing how you pay people?” It’s a simple question that has no easy answers. There are four basic approaches to folding ESG into executive compensation:
ESG metrics are very prevalent in the annual plan, but there’s a caveat to this—what exactly is ESG? Does a worker safety metric qualify as ESG or is it an ordinary operational metric? Different data aggregators make different judgment calls.[2] From our research of the S&P 500 proxies, approximately 16% of companies have a genuine ESG metric, but many more have strategic and operational metrics that could loosely qualify.
ESG prevalence in the long-term plan is much sparser with only 3% of S&P companies taking this bold step forward. Among this small group, over half are utilities companies that are publicly effectuating a transition to renewable technologies wherein the LTIP metric is a small reflection of a much broader corporate transformation.
There’s a debate as to whether ESG metrics by design can have an accounting grant if there is some subjectivity in their measurement. We’ve written extensively about grant dates and spent countless hours with the accounting firms working through edge cases. These cases come down to facts and circumstances, but there is no inherent reason an ESG metric cannot have an upfront-specified grant date. The problem, rather, is that the compensation committee usually wants considerable discretion in drafting the metric, which gives rise to the grant date problems.
Our jury is out on whether ESG metrics belong in the long-term plan. Setting realistic but stretch goals, ensuring all executives have line of sight to drive these priorities, and maintaining the organizational systems and processes to measure progress are all non-trivial undertakings.
For most companies, the scorecard component of the annual plan is a good starting point. This ensures ESG formally enters the performance discourse and gives the company experience in measuring progress and creating accountability. Formalizing ESG as an objective metric in the annual plan is a reasonable subsequent step to take.
Overall, we expect to see at best a gradual uptick in ESG usage in the LTIP, but nothing drastic given the inherent challenges of doing so.
Let’s close by looking at some of the predictions observers have made in the past that have not materialized, why they haven’t, and whether they still could happen in the future.
One is the adoption of economic value added (EVA) or related capital efficiency metrics like return on invested capital (ROIC). We (and many others) predicted a surge in these metrics that purport to measure how effectively management deploys scarce capital to drive earnings. Institutional Shareholder Services, the proxy advisory firm, introduced an EVA metric into its pay-for-performance modeling after acquiring software company EVA Dimensions.
Nonetheless, capital efficiency metrics declined slightly from 2020 to 2021. Overall, they appear in 35% of S&P 500 cases (down from 36%) and in 43% of cases where some flavor of financial metric is used (instead of TSR being the sole metric). We don’t expect this statistic to decline, but it seems like these metrics aren’t becoming the panacea they were hoped to be.
A few factors are behind this trend, or lack thereof. For one, capital efficiency metrics are complex. They involve multi-step calculations and a host of non-GAAP adjustments to ensure they don’t encourage problematic behavior, such as selling off productive assets. This creates a line of sight problem at a time when LTIPs are already under fire for being too complex. Also, capital efficiency metrics don’t make sense in all industries or in every stage of an organization’s lifecycle. They tend to work best for maturing companies with high fixed costs where shareholders may prefer lukewarm investments to be foregone in lieu of growing dividends.
Another predicted trend is the adoption of post-vest holding periods. Although steadily rising, these creative design features remain below 20% in prevalence. Our experience is that post-vest holding periods have strong pros and cons, which explains why some companies are quick to adopt them while others won’t even consider them.
On the pro side of the ledger, they may have no impact on an executive since executives with ownership requirements can simply liquidate older awards first. They also yield a valuation discount, allowing more awards to be granted for the same accounting cost. Finally, shareholders like post-vest holding periods. On the con side, they could impact executive liquidity for executives with low ownership requirements. Post-vest holding periods also can appear punitive since they restrict behavior after an award has already vested.
A third trend that never materialized is the use of longer performance periods. With the steady shift away from options to performance-based RSUs, the near-universal performance period duration is three years. Only 2% of S&P 500 companies have one longer than three years (excluding one-time mega grants where the norm is to set a longer performance period of at least four years).
Why can’t normal LTI awards have a performance period longer than three years? There’s rarely a good answer to that, other than executive opposition and general inertia.
Our view is that lengthier performance periods would be appealing to shareholders, but will never materialize unless there’s radical policy guidance from ISS or a major institutional shareholder. As a practical matter, stock ownership guidelines provide a reasonable substitute and introduce less friction since they’re already a staple in every LTI program.
A red-hot labor market, inflationary environment for products and services, shareholder pressure on ESG topics, and macroeconomic uncertainty make 2022 one of the most complex executive compensation environments in a long time.
We’ve referenced trends among S&P 500 companies throughout this blog, historically viewing this cohort of organizations as pace setters for the broader industry. But as we’ve alluded to, unprecedented disruption is taking place by pre-IPO and newly public companies. In many respects, trends are being set outside the S&P 500 and the question is how much the S&P cohort will adapt and respond in kind. For example, we’ve worked with a number of large S&P companies that have created venture LLCs that award profits interests akin to startups.
2022 is bound to be full of new developments in the compensation space, whether from regulatory action, further disruption in the labor market, or macroeconomic volatility. If we can be helpful as you chart out your path in the new year, don’t hesitate to contact us.
[1] One reason is that mega grants are considerably simpler to pull off pre-IPO since the share usage can be approved by a handful of people. Additionally, by the time additional shares are requested after going public, the mega grant is deep in the rearview mirror and not part of the three-year burn rate lookback period. Nevertheless, a growing number of companies are making outsized grants as public entities that are dealing with ordinary say on pay and share approval requests.
[2] ESG and strategic/operational metrics are distinct from one another. Strategic goals focus on bringing new products to market, transforming operations, and resolving flaws in the supply chain or service delivery chain. Operational metrics pertain to how the company runs the business, such as addressing worker safety or production efficiency. An ESG metric could certainly be called strategic, but not every strategic metric would constitute an ESG metric.
