Subscribe to Our Newsletter
Hear more from Equity Methods: Your trusted partner in equity compensation excellence.
Despite the growing popularity of relative total shareholder return (rTSR) awards, many companies continue to grant awards with financial and operational metrics only (or what ASC 718 calls performance conditions). Since these metrics are usually structured on an absolute basis,[1] a principal challenge is goal-setting: selecting supportable performance levels for the different payout levels.
Consider a basic performance-based RSU structure where the metric is EPS growth, as shown in Table 1:
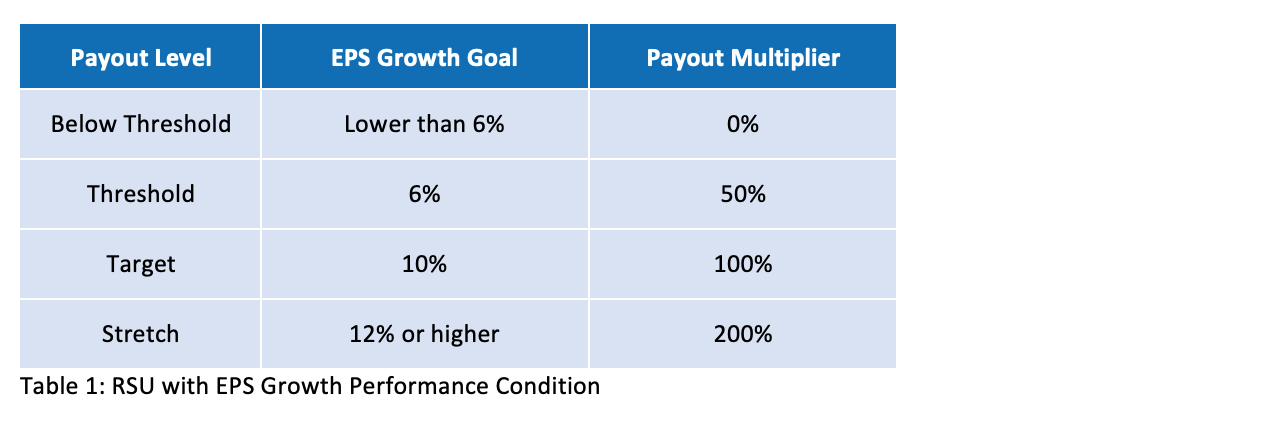
The general rule is that a threshold performance goal should be about 80% achievable, a target level should be about 50% achievable, and a stretch goal should be about 20% achievable.
Historically, financial planning and analysis (FP&A) departments have provided the documentation necessary to set operational goals. Their active participation is vital given the role they play in forming messaging to the Street and contributing to long-run strategic plans. But FP&A targets may be padded for entirely unrelated purposes, such as lowering investors’ expectations of what’s to come. Additionally, FP&A teams usually have a target number in mind, but struggle when it comes to adjusting it upward to set a stretch goal and downward to set a threshold goal: Should the adjustment be 10% or 20% of target? These are questions the average FP&A team is less comfortable with answering.
On top of this, compensation committees expect more today. They’re asking for more evidence that the proposed goal levels are adequately rigorous. Statements like these are becoming common:
“Prove to me that 12% really is a stretch goal, that it’s really only 20% achievable.”
“Perhaps 6% EPS growth is too low of a performance threshold.”
Fortunately, compensation committees don’t have to rely on guesswork to define the wedge between target, threshold, and stretch metrics. In the pages that follow, we’ll describe three quantitative methods that facilitate data-driven decision-making. They’re not intended to replace the active participation of FP&A, but supplement it and stress-test what they contribute. The first is a relatively new technique that makes use of historical data, the second is Monte Carlo simulation, and the third involves cross-referencing analyst expectations.
Distribution fitting involves running statistics on historical company and/or industry data to build a probability distribution of performance metric outcomes. The technique isn’t new. In medicine, we calculate rates of success for different procedures. In sports, Michael Lewis’ “Moneyball” chronicles how the Oakland As use data to make team selection decisions.
To illustrate, let’s look at the distribution of return on equity (ROE) for Acme Corp and its respective peers over a 10-year period (Figure 1).
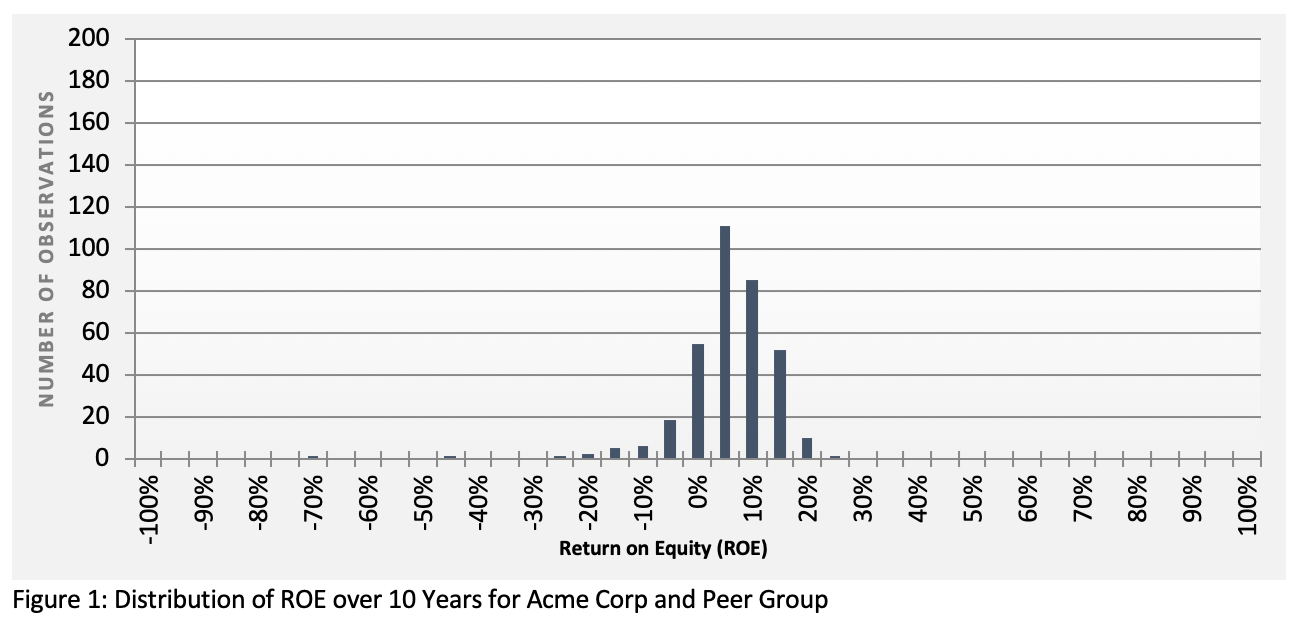
The way to interpret this figure is to note a “clustering” of observations in the ROE neighborhoods of 5%, 7.5%, 10%, and 12.5% (7.5% being the most frequent level with 62 observations—the tallest line). Then, of course, there are outliers. These include one observation involving ROE of 25%, one of -67.5%, and one of -45%. Combined, this tells a story of how distributed ROE levels are among Acme Corp and its industry peers.
The data in Figure 1 can be reconstructed to produce Figure 2, which includes a cumulative percentage so that Acme Corp can determine the corresponding ROEs for different percentiles in the data. Acme’s objective is to pick a stretch goal that’s 20% achievable, a target that’s 50% achievable, and a threshold that’s 80% achievable. Given that logic, Acme pinpoints each of the three percentiles in the data to determine the corresponding ROE.
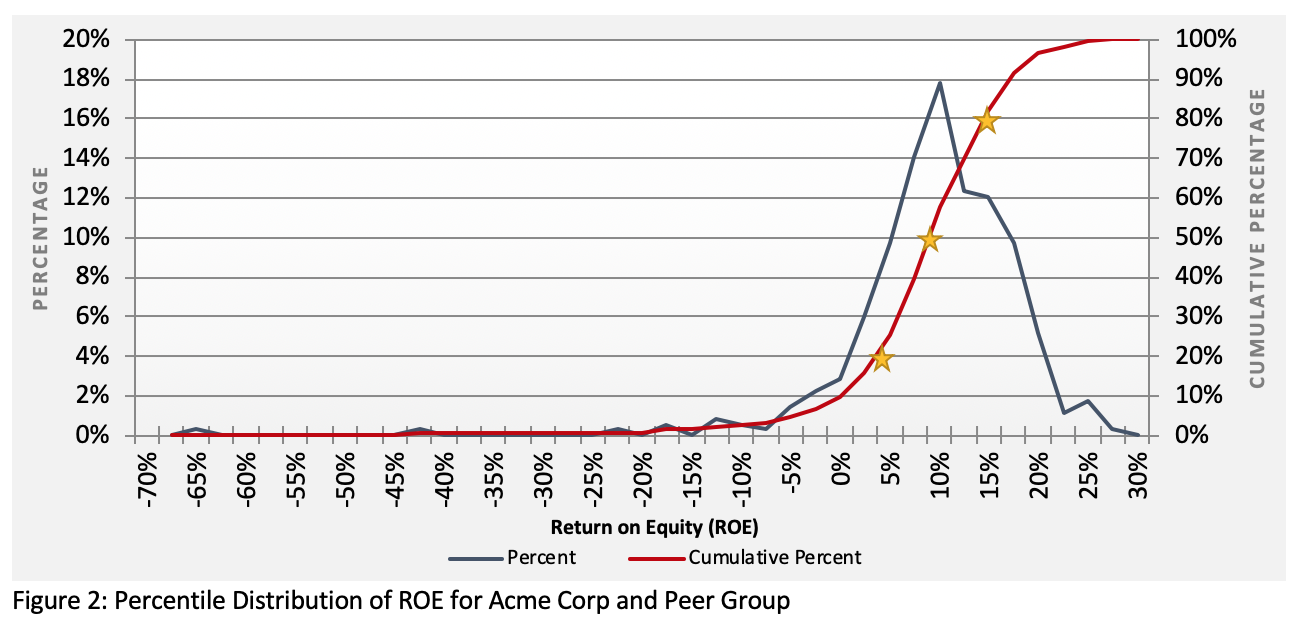
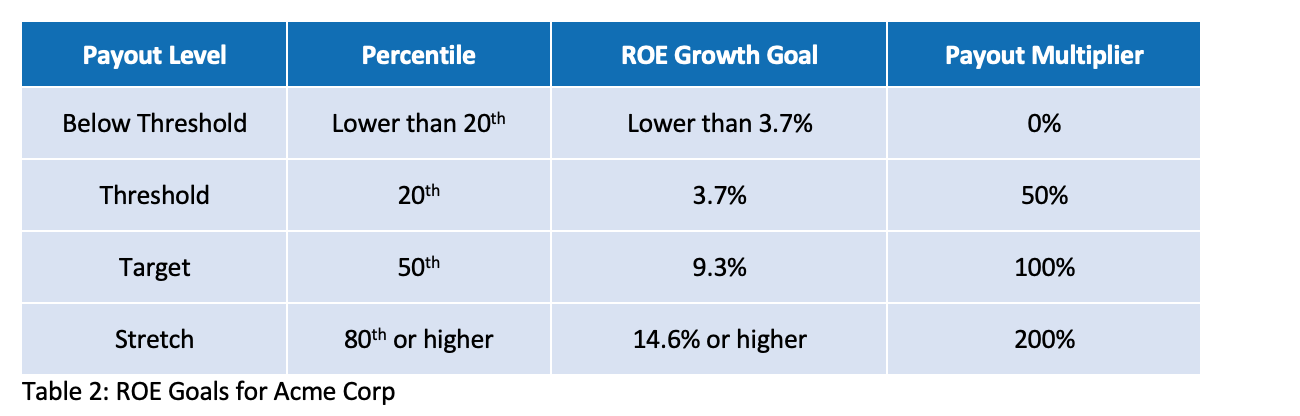
The red line in Figure 2 shows how Acme arrived at the following ROE goals.
This approach relies heavily on peer firm and industry data. While it could be performed using only the issuing firm’s historical data, generally there’s a preference to pool large amounts of data. If pooling industry data isn’t viable due to irreconcilable differences among companies, then the next method may be more appropriate.
The second approach is similar to distribution fitting, but uses Monte Carlo simulation. Many know Monte Carlo simulation as a way to estimate the fair value of TSR awards. But it’s also a broadly flexible tool that can be used to model all kinds of variables and situations. This includes everything from weather and climate to engineering, sporting events, and of course business.
The idea is not to treat Monte Carlo simulation as a crystal ball, but rather as another piece of evidence to support the goals you set. It helps show the compensation committee that a rigorous and objective process was carried out.
Monte Carlo simulations work by using predefined distributions of possible movement to assess the probability of future outcomes. Each simulation generates random outcomes based on the distributions specified. It’s typical to perform the simulation numerous (e.g., 100,000) times in order to produce the full range and pattern of possibilities.
The first step in building a simulation model is to define the distribution of these potential outcomes. As you would imagine, this can get very technical very quickly, so we’ll stick to the key considerations. Consider the common performance metrics in Table 3.
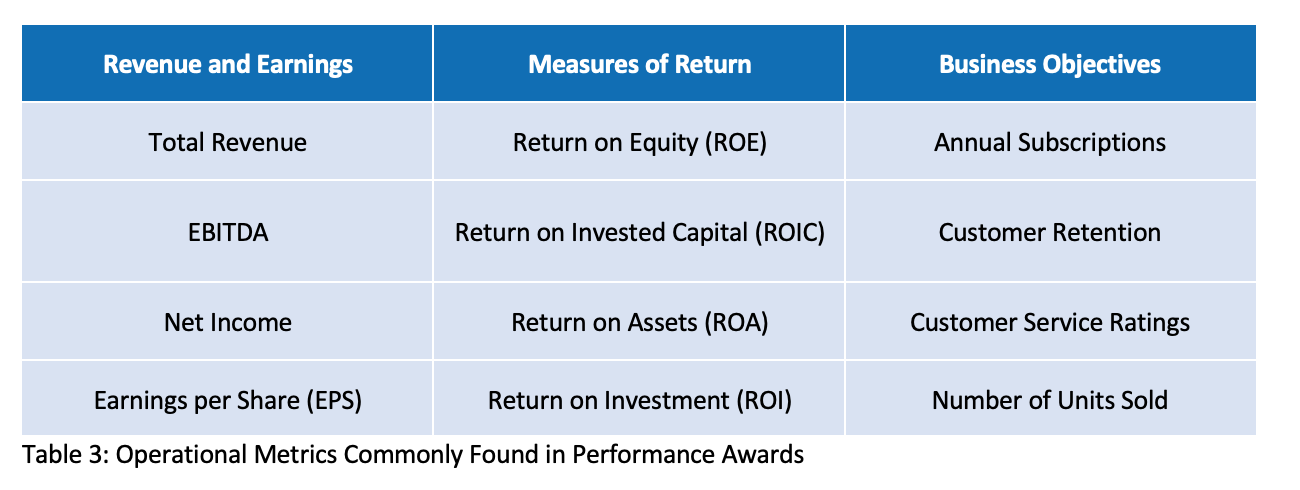
Many metrics have generally accepted ways to model ranges of potential outcomes. This stage of the analysis simply boils down to fitting the metric of interest to a distribution. For example, we often refer to “normal distributions” when discussing variables like the weather or stock prices.
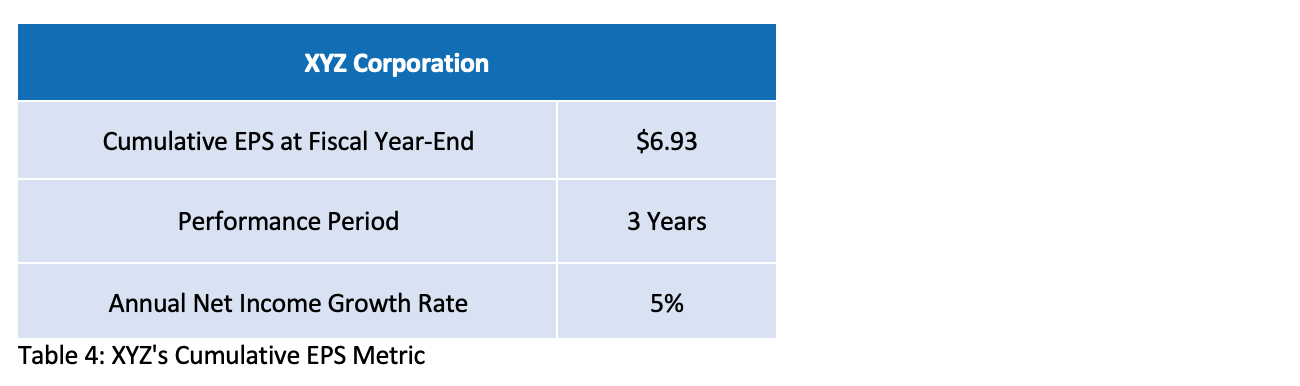
Let’s look at how XYZ Corp developed goals for a performance-based RSU with vesting contingent on three-year cumulative EPS. For five years, the EPS metric has paid out at max, prompting the compensation committee to voice serious concerns that goals were being padded.
Historically, the compensation committee had set the performance goals based on management’s analysis, which leveraged industry-wide analyst estimates. Table 4 outlines the award.
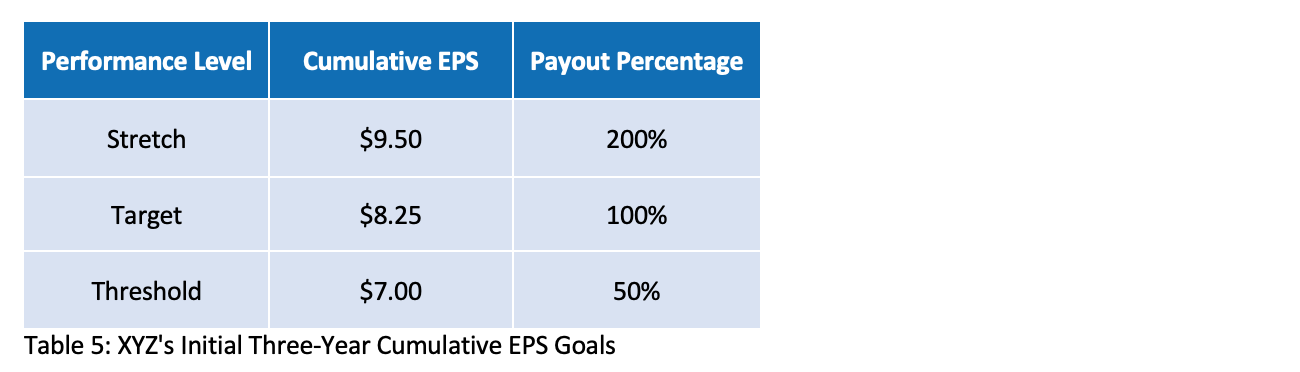
Management at XYZ started out by developing three-year cumulative EPS goals the same way they had in the past—by consulting with finance and applying some additional adjustments (Table 5).
Then XYZ turned to Monte Carlo simulation as an objective yardstick to corroborate its internal goal-setting effort. XYZ had never used a Monte Carlo simulation before, so they were especially curious (even skeptical) about the outcome. Figures 3 and 4 show the results.
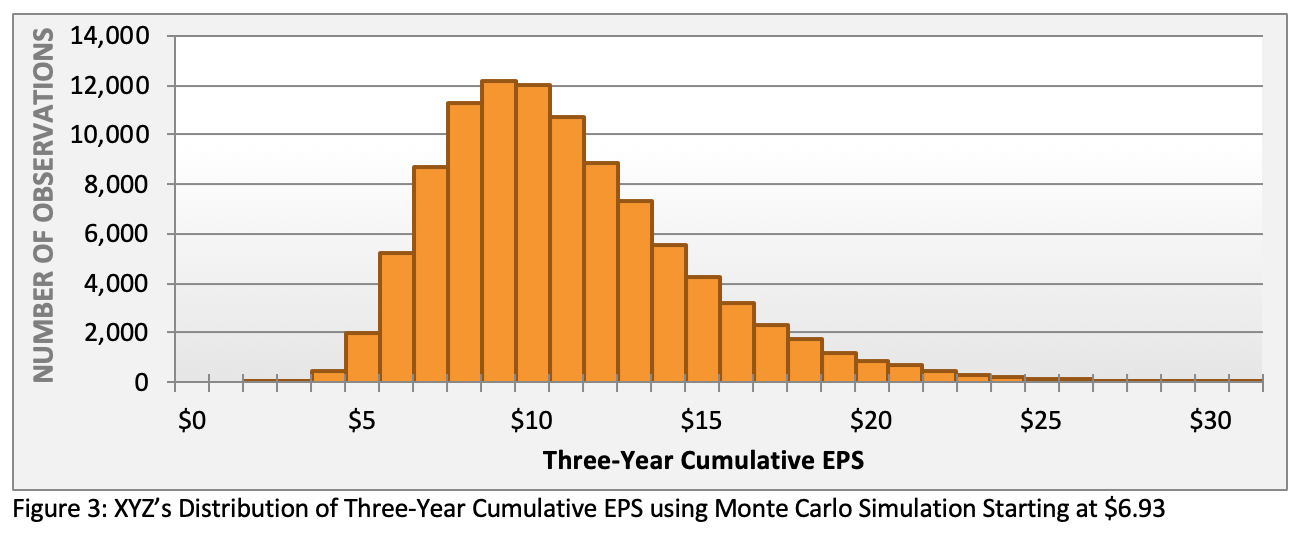
Management used the probabilities of achievement for each performance level and pinpointed the corresponding percentiles within the distribution. Figure 4’s gold stars at the 25th, 50th, and 75th percentiles fit with XYZ’s pay philosophy regarding the difficulty of threshold, target, and stretch goals.
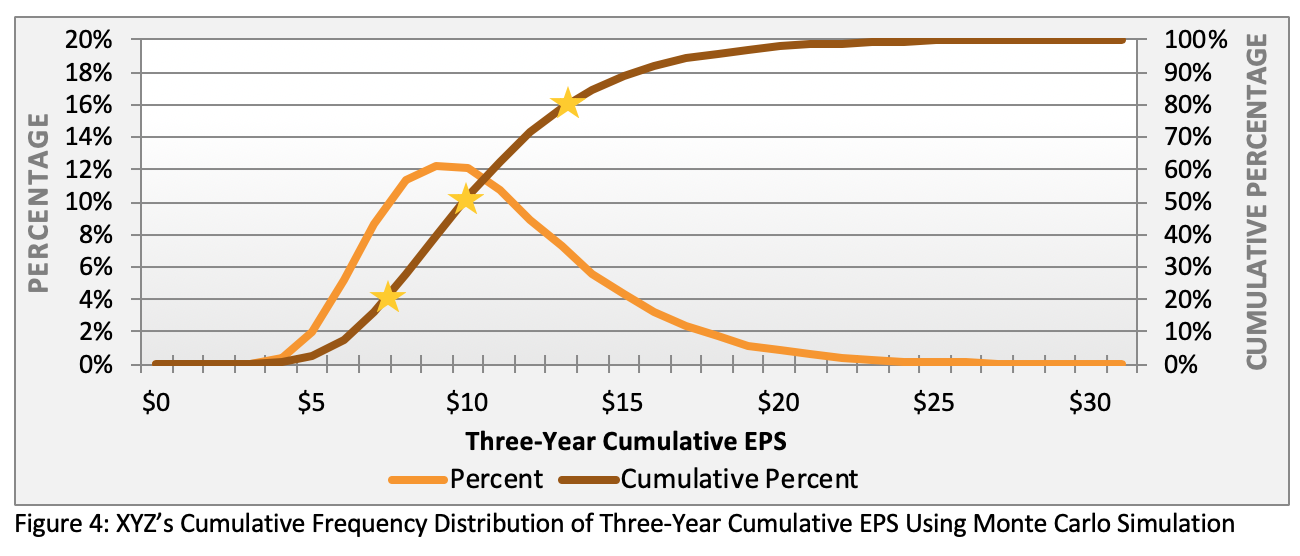
Using these percentiles, management constructed the simulated cumulative EPS goals shown in Table 6:
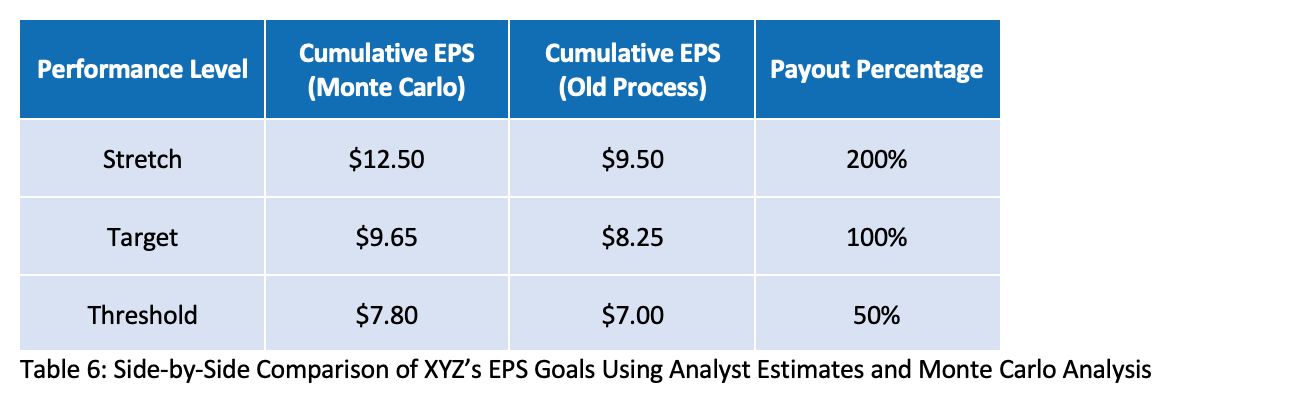
Management was surprised to find that their preexisting process yielded a stretch goal that was less than the target goal under the Monte Carlo method. After stress-testing the underlying assumptions, management took the results as evidence that the previous approach resulted in targets that indeed were too lax.
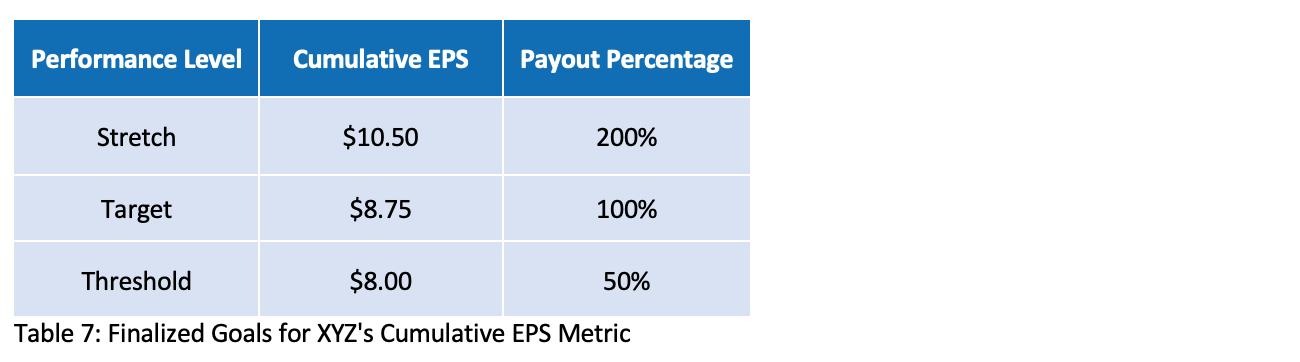
However, XYZ’s consultants advised management not to blindly rely on Monte Carlo simulation—after all, it’s assumption-driven and doesn’t factor in contextual factors expected in the future. Ultimately, XYZ set goals in between the levels suggested by its legacy process and the simulation modeling, which the compensation committee felt much better about approving (Table 7).
Here, we introduce a third technique: cross-referencing goals against analyst expectations. Analyst reports are effectively a quantified reflection of the market’s expectations of future performance. If, for example, analysts expect EPS to come in at $2.10 and an EPS stretch goal is set at $1.95, there’s a brewing problem insofar as the market might scoff when the company pays out at maximum.
Analyst reports are the product of various financial institutions and market intelligence firms. Stock analysts usually specialize within an industry and cover only a small handful of firms so that they can get to know the ins and outs of those organizations. They conduct market research, talk to management teams, and run bottom-up analytics that disaggregate historical data to make it more forward-looking. Since their research reports typically aren’t free, you may need to be a customer of a brokerage firm or subscribe to a data provider such as Bloomberg or S&P Capital IQ to access them.
By themselves, analyst reports can be long and difficult to follow. The good news? For goal-setting purposes, we don’t care whether the stock is a buy or a sell—we’re simply looking for estimates of future performance. Most analysts will offer an estimate of this year’s and next year’s core financial metrics.
The first step is to find multiple analyst reports that contain the data that you’re looking for—the more, the better. For example, suppose Big Corp is granting a long-term performance award with a three-year cumulative revenue metric and has a starting revenue of $500 million. Since the revenue metric spans three years, Big Corp needs to find analyst reports that forecast three years into the future.
It’s very common for analysts to estimate performance for year one, not so common for years two and three. Big Corp could find six analysts that estimated revenue performance three years into the future. Of the six, Big Corp chose five since one of the analysts was an extreme outlier.[2]
The next step is to aggregate the analysts’ estimates for all three years. Then take the average or median, and sum the results across the three years. Table 8 shows the results of this process for Big Corp (figures are in millions).
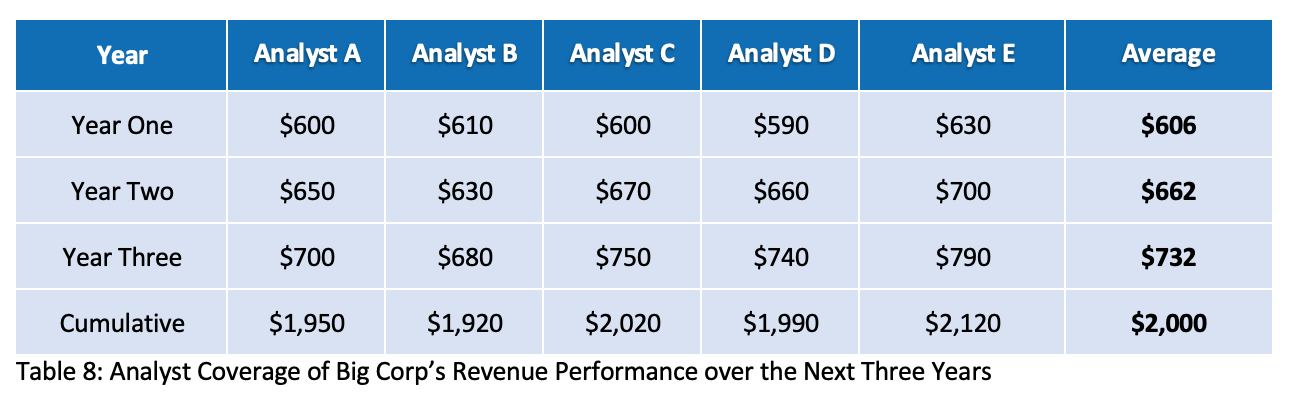
Fundamentally, analyst estimates represent the market’s expectations of performance in a given year, so the results in Table 8 would be useful for the target goal. In order to create threshold or stretch goals, you can either incorporate subjective assumptions (e.g., setting a stretch goal 20% higher than the target) or you can explore the outlier analyst estimates. In this case, the outlier estimate is $2,400 million, which could be a helpful data point in setting the stretch goal. At a minimum, this might impose an upper bound on where you set the stretch goal, just as $2,100 might imply a lower bound.
Most of the time, the FP&A or corporate strategy team creates goals based on the annual budget or other internal projections. For mature, stable companies with strong forecasting abilities, this might be enough to satisfy the compensation committee. But other companies need more than that to show rigor and objectivity.
Why? For one thing, internal teams lack the data to determine an adequate level of dispersion between threshold, target, and stretch performance. They might have a solid point of view on likely or target future performance, but their roles generally don’t require them to set a baseline goal that is largely (e.g., 80%) or barely (e.g., 20%) achievable—which is precisely what we need to design long-term incentive awards.
Most companies can benefit from a goal-setting process that triangulates multiple data points. That way, companies can stress-test their goals to see whether they might be too easy or out of reach. If other methods produce goals that are radically different, it’s worth a conversation with the forecasting team to understand what’s driving the difference and whether changes are in order.
We cannot stress enough that none of these methods are perfect. Their core purpose is to help flex and refine FP&A-driven estimates. This way, the compensation committee will know that a rigorous process is in place.
[1] As a general rule, financial and operational targets are absolute measures. In other words, they’re hurdles for the company to clear regardless of what peer companies are able to do. Relative targets can be used but are uncommon, mostly because they’re hard to compare thanks to the different accounting policies and conventions that companies use. In contrast, TSR awards are normally set on a relative basis because stock prices are much more comparable than accounting metrics.
[2] There are no black-and-white rules about how many analysts to draw on or whether to remove any outliers. In general, consider how many sources there are. Then decide if filtering them makes sense in your situation.
