Subscribe to Our Newsletter
Hear more from Equity Methods: Your trusted partner in equity compensation excellence.
On July 31, 2023, the Financial Accounting Standards Board (FASB) issued the exposure draft of an Accounting Standards Update (ASU): Income Statement—Reporting Comprehensive Income—Expense Disaggregation Disclosures.
The comment period runs through October 30, 2023, and the FASB has signaled it will allow either prospective or retrospective adoption. Our best guess is the final ASU will be released in 2024, but the FASB has stated that it will evaluate timing in light of comment letter feedback it receives.
Investor groups may argue the exposure draft doesn’t go far enough in requiring disaggregated performance information. But even if it’s finalized in its current form, the draft would provide a wealth of new information in the financials and potentially disclose information that companies have historically considered sensitive.
Here we’ll discuss the substance of the exposure draft, key motivations and next steps in the process, and how you can begin preparing. We’re particularly interested in this topic because a core effect is to break out human capital costs across key income statement expense categories.
A 2021 FASB Agenda Consultation session with investors and other market participants (i.e., the users of financial information) identified a perceived lack of granularity in expense captions. The proposed ASU identifies three key benefits to investors in providing disaggregated expense information (ASU 220-40-50-1):
Before delving into the proposed standard, let’s take a detour to understand the problem it’s trying to solve. We’ll look at General Motors’ financials for fiscal year 2022:
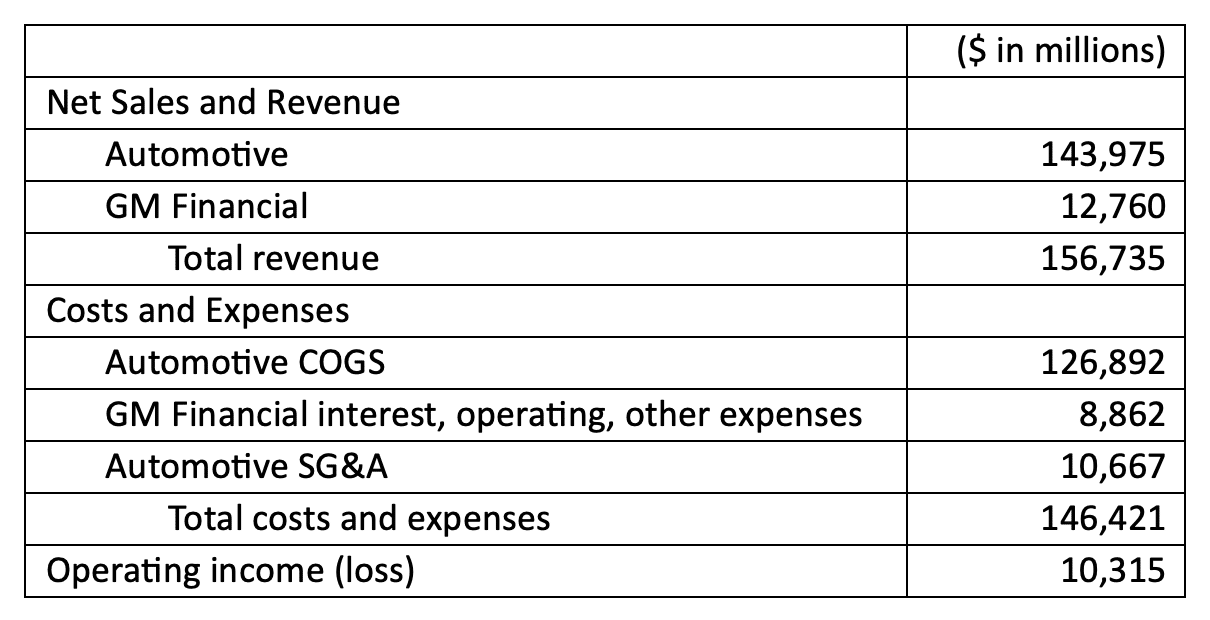
Note 3 in GM’s financials disaggregates revenue by new vehicle sales, used sales, services, leasing, and finance charges. Note 5 provides detail on their receivables and collectability risk. In Note 23, GM discloses high-level data for their four reportable segments: GM North America (GMNA), GM International (GMI), Cruise, and GM Financial (e.g., revenue with a jump straight to EBIT).
There’s not very much we can glean from the financials in the way of fixed versus variable costs, operating leverage, and human capital utilization. In particular, it’s tough to draw inferences from the $126 billion in automotive COGS. The MD&A states:
The most significant element of our Automotive and other cost of sales is material cost, which makes up approximately two-thirds of the total amount. The remaining portion includes labor costs, depreciation and amortization, engineering, freight and product warranty and recall campaigns.
While this is helpful context—and more than many companies disclose—there’s still relatively little we can do with it.
Consider Tesla’s 10-K for fiscal year 2022. In it, automotive COGS is $49,599 million and automotive revenue is $67,210 million. This implies Tesla’s gross margin on car sales (excluding services) is 26.2% versus GM’s 11.9%. Tesla provides a laundry list of components to automotive COGS but doesn’t offer any insight into their relative proportions. An investor can easily glean that Tesla has a superior gross margin, but they won’t be able to disentangle where those efficiencies come from and how they’re split between fixed and variable costs, or materials and labor.
It’s not hard to see why investors express concern with the lack of visibility into the level of detail in financial statements. This opacity makes it difficult to assess performance, formulate future cash flow expectations, and draw relative comparisons.
Disaggregating the expense captions in the financial statements helps investors learn companies’ cost structures and future cash flows. It also improves investors’ ability to understand company performance over time and draw cross-sectional comparisons among like entities.
As proposed, ASU 220-40-50-4 would require companies to disaggregate all relevant expense captions presented in the income statement for continuing operations into the following expense categories:
This disaggregation should be provided in the notes to the financials in a tabular format. The disclosure should also include a qualitative description of the amounts remaining in relevant expense captions that aren’t separately disaggregated. ASU 220-40-50-12 requires various other tabular disclosures that aim to pinpoint specific expense types (e.g., impairment losses) or house them entirely within one expense caption.
The parenthetical concerning one-time employee termination benefits is interesting, because this means employee compensation will usually turn into two sub-categories. Severance and special exit packages for named executive officers are already disclosed in the proxy, but the ASU would require information on broad-based turnover that’s not disclosed anywhere else.
The five disaggregation categories are also referred to as natural expense classifications. In contrast to a functional view of the P&L, a natural expense view groups expenses according to the “types of economic benefits received in incurring those expenses.” For example, employee compensation cuts across multiple functions and standard P&L line items, but confers one type of economic benefit—labor. For disaggregation by natural expense classification to work, the five categories need to be independent to avoid under-counting or double-counting.
As noted, adoption can be done prospectively or retrospectively. Private companies and not-for-profit entities are exempted. The effective date hasn’t been decided and the exposure draft includes a question on timing and complexity of adoption.
Every company structures its income statement slightly differently, and the proposed ASU does not mandate any revisions to the face of the income statement, only that the expense captions in the income statement that have continuing operations be disaggregated into the five natural expense classifications. Although a specific format for doing so isn’t required, the exposure draft provides a few examples that will likely influence methodology.
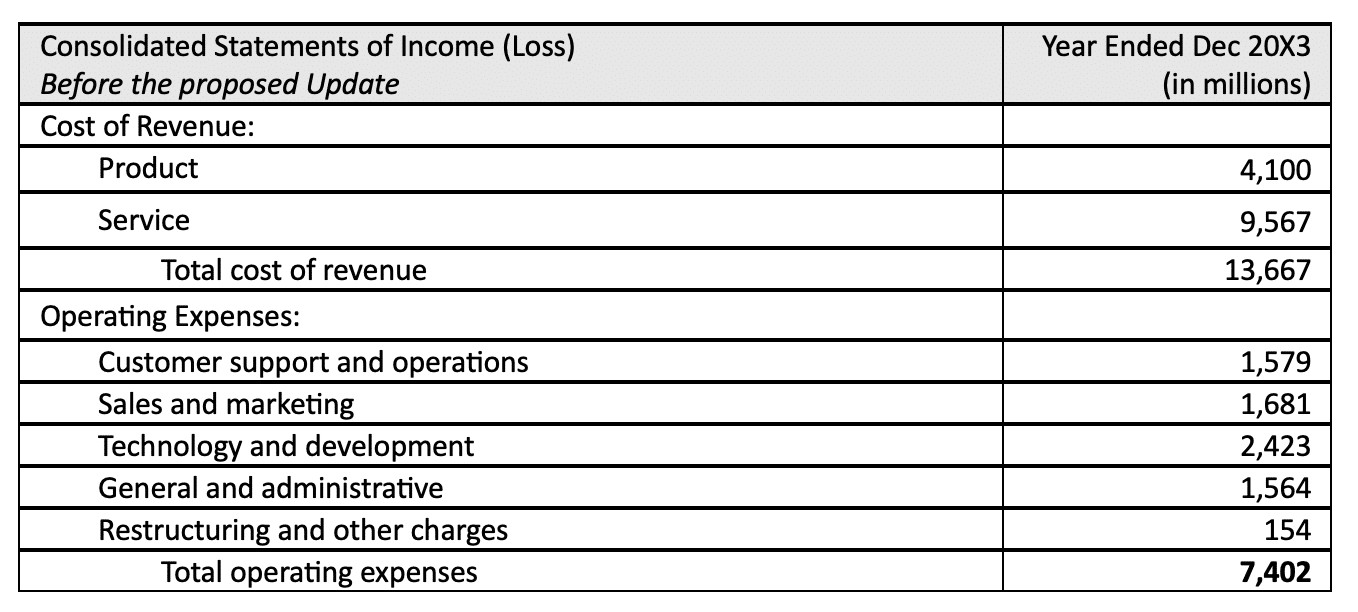
Here we’ll walk through an example of how to implement expense disaggregation using hypothetical data inspired by a real company in the technology industry, which we’ll call TechCo. Prior to adopting the ASU, TechCo has five expense categories within the operating expenses section of its income statement.
After adopting the ASU, each expense category should be disaggregated to inventory and manufacturing expense, employee compensation (with one-time termination benefits getting carved into a different line item), depreciation, intangible asset amortization, and DD&A (as applicable).
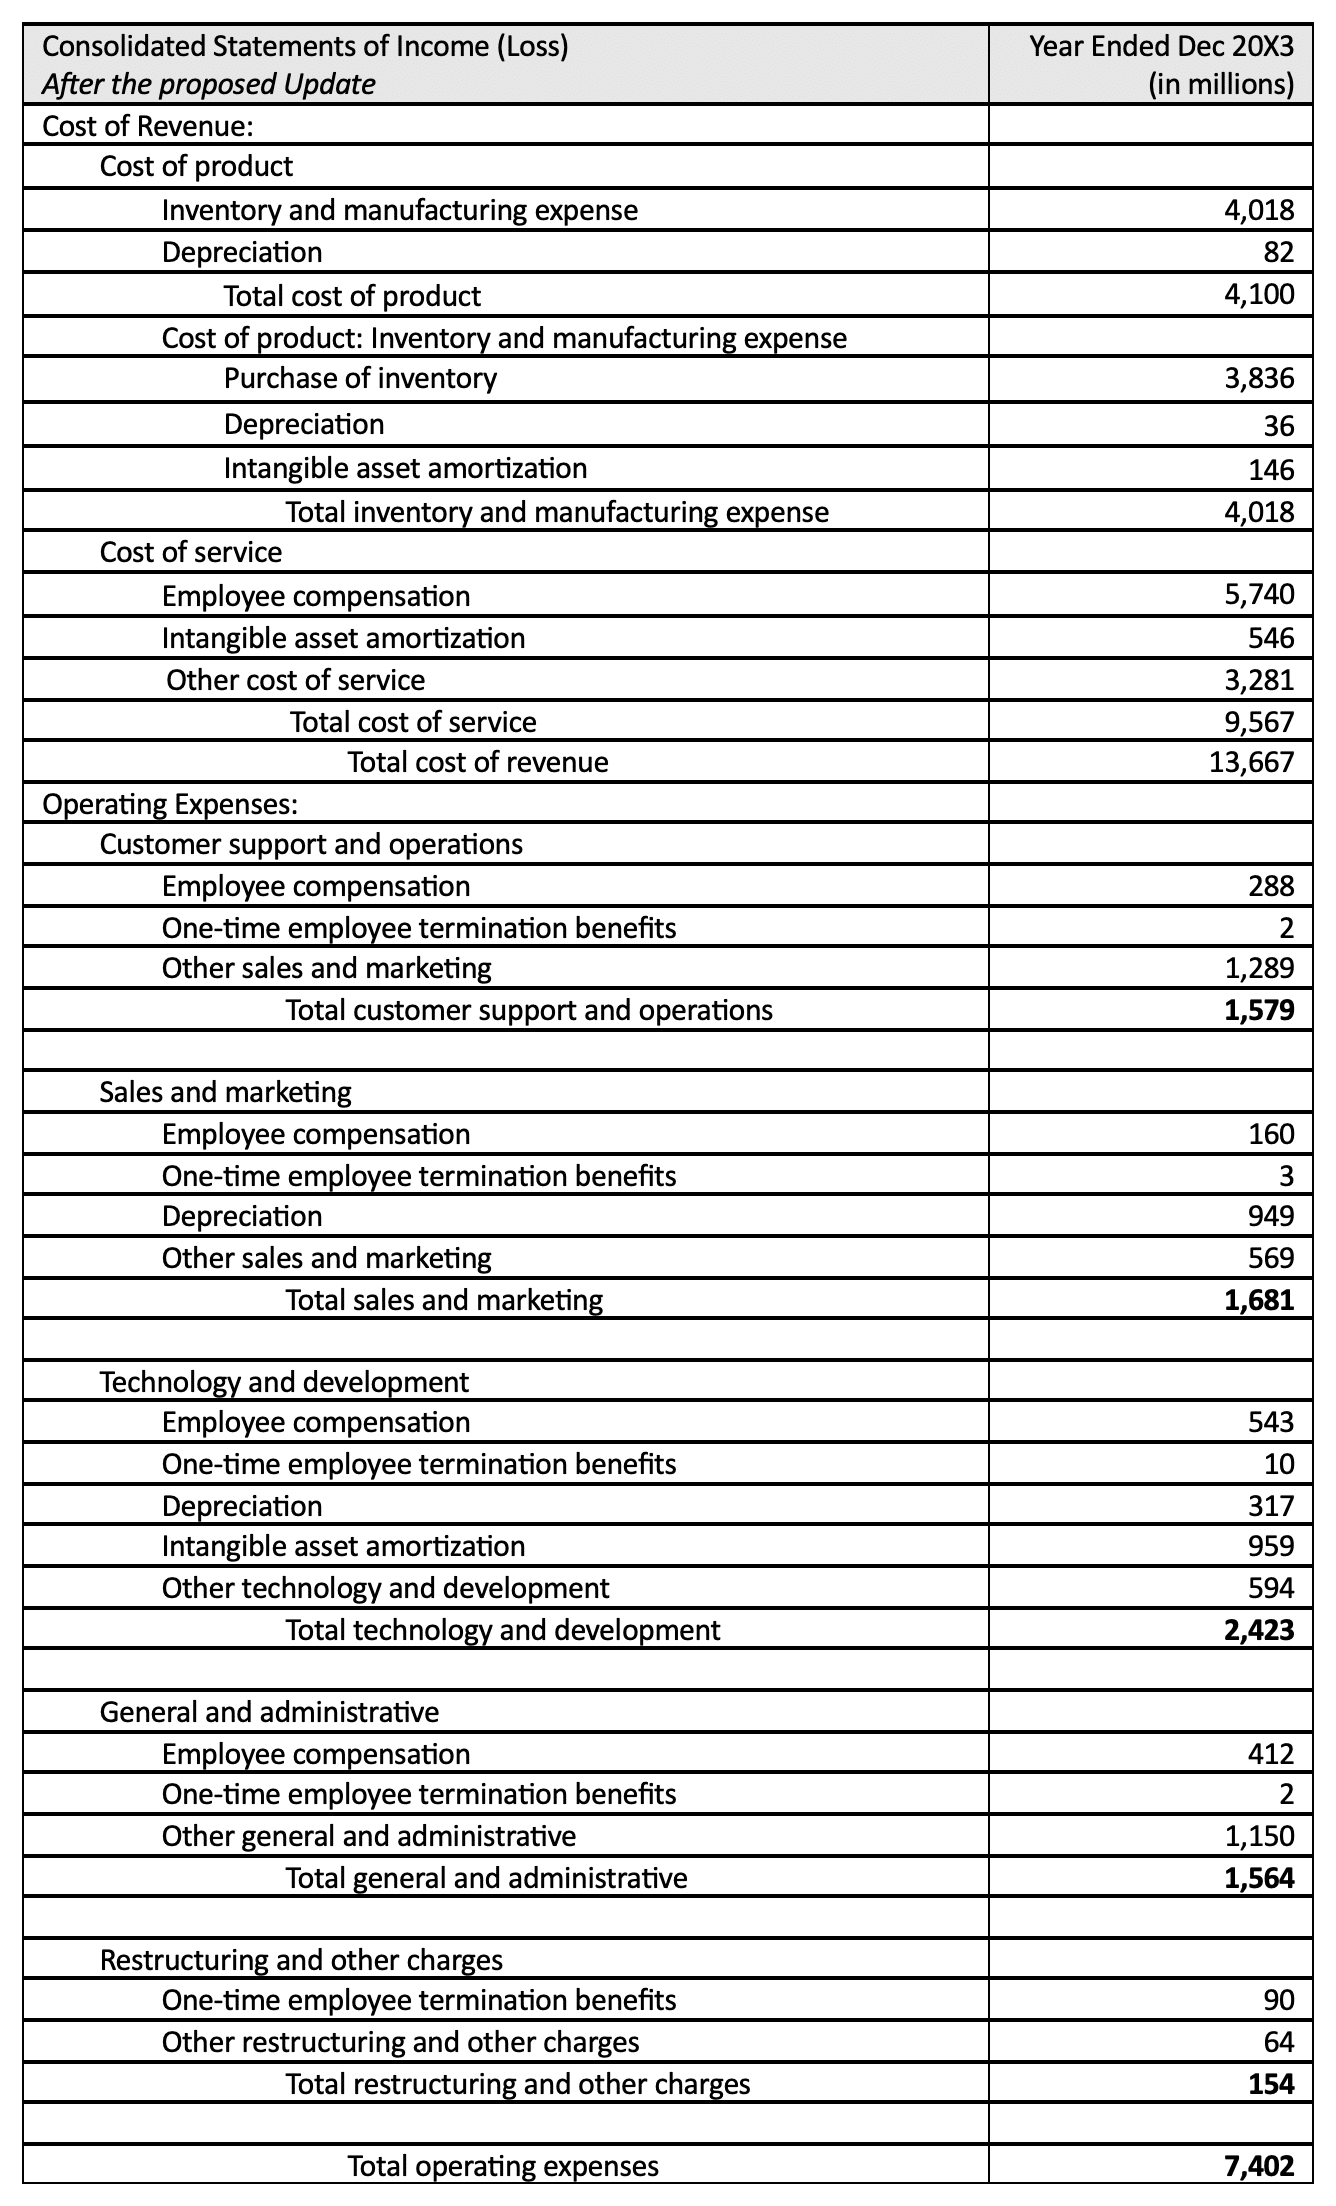
The company’s definition of selling expenses and the dollar amount are required to be disclosed as well.
Companies in the manufacturing industry will have a little extra work. They need to further disaggregate inventory and manufacturing expenses. Pursuant to paragraph 220-40-50-17, additional disaggregation is required for costs capitalized to inventory and manufacturing-linked costs expensed in the period, in addition to a host of disclosures.
For most companies, including our case study of TechCo, very little is known about employee compensation costs. The stock-based compensation footnote provides the most direct clarity, but this excludes salaries and other benefits, as well as termination-related costs. It’s no surprise that even for companies outside human capital-centric industries, employee compensation costs are representing larger portions of their overall cost base.
The ASU catapults employee compensation data into the open. By disaggregating it across expense captions, investors can crunch ratios, track changes over time, and draw cross-firm insights. They can study how employee costs are being allocated throughout the organization and compare these strategic allocation decisions to industry peers and competitors. This is also why many of our clients are apprehensive about the ASU, since it introduces a broad spectrum of information that’s never been available before—and which may still lack context to outside parties.
Let’s shift and focus on the key implications of the ASU and how to begin preparing. We’ll start with the external view of how we expect investors to use the newly disclosed information. Then we’ll look internally at the preparation challenges, focusing specifically on employee compensation. Of course, other areas of disaggregation such as manufacturing expenses and inventory will have their own unique challenges. We anticipate this ASU being simple for some companies to adopt and complex for others depending on the nature of expenses and accounting systems in use.
Again, focusing only on employee compensation, we see this ASU as supplying investors a wealth of new information. Below are some possibilities for how investors may use the newly disclosed data:
Bear in mind that the SEC is getting close to releasing an updated human capital management (HCM) disclosure rule that will likely require a host of additional quantitative metrics. Investors will likely pair the SEC’s new disclosure content with this expense-related content.
Outside of employee compensation information, there’s even more that can be gleaned. This includes richer insight into an organization’s operating leverage, fixed versus variable costs, and operating efficiency.
The answers to these questions will obviously impact valuation. Unlike some past ASUs which had an immediate impact on valuation, we expect this one to be slow and gradual. Investors will need time to build models and study longitudinal and cross-sectional relationships. However, one short-term impact we anticipate is an entirely new category of questions on earnings calls. It’s no secret that preparing for an earnings call or even standard investor outreach sessions is an enormous task. With this much new information being released in the financials, the breadth of potential questions increases markedly.
For preparers, it’s important to understand what level of granularity currently exists in underlying expense tracking and systems capability. If the five natural expense categories required by the ASU are already being tracked at a detailed level, there may not be much incremental effort. Otherwise, the first step will be to bring internal (and external) stakeholders together to assess the scope of system updates required.
Employee compensation will naturally be as complex as the organization itself. When companies engage us to perform their equity compensation (or other) financial reporting, we track all the data at the most granular level possible—by person, award, and tranche. We then match the data with comprehensive indicative data, including P&L line item, country, cost center, and so on. As a result, we expect our clients to be able to quickly reframe reports based on the disaggregation framework required by the ASU.
On the other hand, some systems calculate these expenses at a pool level, or they calculate expense at the person level but aren’t connected with the necessary indicative data. This will likely require more internal system rework. Another nuance to watch out for is employee mobility and how to deal with forfeitures in these cases. The classic assumption of many systems is that if an employee started in function A, moved to function B, and then forfeits in function B, they must have been in function B from the beginning and all previously recognized expense should be backed out of function B. Depending on the materiality, bifurcation based on time spent may be more appropriate.
Employee stock purchase plans (ESPPs) present additional challenges since many companies continue to calculate ESPP expenses at a pool level. Under this new framework, tracking all employee compensation costs at the person level and matching to the appropriate P&L line item for disaggregation will be advisable.
A final challenge is to isolate one-time employee termination benefits for standalone disclosure across each P&L line item. While companies are accustomed to tracking and disclosing termination benefits for their proxy named executive officers, some may lack robust processes for doing the same across their entire employee base. With stock-based compensation, for example, it’s not uncommon to lump one-time costs into the ordinary course of expense recognition (e.g., a vesting acceleration gets added up with all other normal expense recognition). Under the proposed ASU, these values will need to be bifurcated for separate disclosure.
We’ll be monitoring comments and reactions to the proposed ASU in the months ahead. Anecdotally, we know that many companies are concerned about the additional disclosure and the possibility of investors taking values out of context or drawing inappropriate inferences. On the flip side, many investors were pushing the FASB to do much more than they did in the proposed ASU, so it’s possible a final ASU could be more expansive than the exposure draft.
Our best guess is that the final ASU will be released in early 2024 with an effective date in the middle of 2024. For calendar year filers, this would mean their annual reports for fiscal year 2024—released in early 2025—would need to comply with the new ASU.
In the meantime, please don’t delay in determining whether your expense reporting tools are up to the task. When it comes to stock-based compensation and related human capital reporting, contact us if you’d like to discuss the proposed ASU and what it means for your organization.
