Subscribe to Our Newsletter
Hear more from Equity Methods: Your trusted partner in equity compensation excellence.
On November 16, ISS released updates to its proxy voting policies. The updates apply to shareholder meetings occurring on or after February 1, 2018.
There are numerous revisions, which have spurred a flurry of comments from consultants and attorneys alike. Here, though, we’d like to hone in on one specific revision—changes to the pay-for-performance evaluation process—and delve into some of the new risks the changes raise.
First, the revision. As predicted, ISS is adding a financial test to its quantitative pay for performance screen, which will be called the financial performance assessment (FPA). This is a major change to prior practice.
We applaud the effort to further balance out the framework used for relating pay and performance. We also have concerns that this new test may introduce some extra noise and ambiguity into pay-for-performance assessments, thereby requiring more explanation or supplementary disclosure. We are of course eagerly awaiting additional details, which ISS has said will follow in a whitepaper.
Toward the end of this article, we suggest actions companies can begin taking, which involve modeling how their relative metrics may look and preparing additional analytics to more thoroughly explain their story.
But first some background. The financial test is in response to a growing concern among companies and investors that relative total shareholder return (rTSR) is an incomplete and inadequate measure. New tests that measure financial and operational performance are supposed to convey a more holistic story around a company’s pay-for-performance relationship.
In 2017, the three ISS pay-for-performance tests were multiple of median (MoM), relative degree of alignment (RDA), and pay-TSR alignment. Starting in 2018, ISS will add a fourth test, financial performance assessment (FPA), that can affect companies in two ways. First, the ones assigned a medium level of concern from the three core tests can be taken down to a low if they excel in the FPA test. Conversely, companies with a low level of concern from the three core tests can be taken to a medium if they perform poorly in the FPA test.
The FPA test will involve different financial metrics that are selected and weighted differently by industry. The metrics include return on invested capital (ROIC), return on assets (ROA), return on equity (ROE), EBITDA growth, and operating cash flow growth. Like TSR, companies will be assessed against their peer group. ISS, of course, emphasizes they’re not suggesting that companies necessarily base their compensation programs on these metrics.
Even so, we believe these changes will give rise to a new array of potential concerns for companies to manage. For instance:
The metric selections and weightings could bear little resemblance to how your business should be evaluated.
We don’t doubt that ISS has done extensive statistical analysis on the relationship between these metrics and long-term performance.
But what statistics often miss is that while relationships can be gleaned across very large volumes of data, those relationships may not hold up for any given instance of the data. For example, research shows that small firm stocks will, on average, generate higher returns. But if we look at any given stock, the return might be -100% (think of how many firms declare bankruptcy leaving equity holders with worthless paper) or +6,000% (Tesla was once a small firm stock). The point is that extensive backtesting doesn’t necessarily apply to your situation. It merely suggests that across thousands of firms there are predictive trends.
To complete the point, it’s quite possible that ISS’s model could assign more weight to metrics that don’t correctly describe your business or the most appropriate way to measure your performance. Your stock analysts might care about an entirely different set of factors than the metrics picked by ISS for your industry as a whole. In short, you might be given high or low grades based on a set of criteria that simply aren’t the right criteria for your company.
To be sure, ISS did consult investors on the short list of metrics to consider via its annual policy survey. That said, the professionals at asset management firms tasked with responding to these surveys and submitting proxy votes may not be the stock analysts deciding whether to buy more or less of a given stock. It’s the latter group that will form very firm-specific and nuanced views on the metrics of maximum importance to any given firm.
Because the stock price reflects all matters of investor concern, both present and future, relative comparisons of TSR are a better reflection of changes in investors’ thinking than relative comparisons of financial measures like ROIC, ROA, or ROE.
TSR is an output that encapsulates the stock market’s best assessment in the present day of all the various inputs and activities being performed by the company during a given period. Parties can argue over the limitations of rTSR, but the bigger picture is that relative financial assessments don’t embed market expectations the way TSR measures do.
An illustrative example is helpful. Security prices are based on the market’s aggregate expectations of future cash flow, which for the moment we can think of as the same thing as earnings. Suppose the market expects Company A to post a ROIC of 11% and its peer, Company B, to post a ROIC of 14%. Stock prices today reflect those expectations, and Company B is likely trading at a higher multiple of invested capital than Company A. Then, suppose Company A posts a ROIC of 12% and company B posts one of 13.5%. On a relative basis, Company B has outperformed Company A. But that’s not quite how markets behave—they behave by buying/selling securities in response to their expectations being missed or exceeded. In this case, Company A would be rewarded by the market and Company B would be punished.
In short, TSR provides a measure of how a company performed versus market expectations. In this way, companies that improve their operations (relative to expectations) will see higher TSR than their peers. Financial metrics, on the other hand, incorporate a company’s past decisions and may be slow to adjust as time moves forward. In this way, judging a company by these operational metrics will likely provide only limited information on the results of a strategy set in motion over the past few years.
None of this is to suggest that a relative financial metric is flawed, but it does mean that companies may be surprised to discover they have a high (or low) relative TSR score coupled with a low (or high) relative financial metric score. Because the metrics are measuring different things, they might move in rather different directions over time—especially when calculated in a relative capacity.
The FPA test is based on as-reported GAAP metrics, which may introduce noise into comparisons of results.
From a practical standpoint, it’s understandable why ISS’s test uses as-reported GAAP results, since reasonable people can disagree about what to include and exclude in normalized earnings measures, rendering both street earnings and one-size-fits-all measures controversial. But this doesn’t change the reality that ultimately, every stock is evaluated by the market using extensive adjustments to as-reported GAAP numbers.
The simplest example of how there will be noise is accounting standard changes. The new revenue recognition standard (ASC 606) goes live in 2018, but it affects companies in extremely different capacities. Even within the same peer group, some organizations will show major revenue volatility between 2017 and 2018 and others won’t. Analysts tackle this by making adjustments to as-reported results in order to arrive at an informed view of what’s actually happening within an organization.
Another example involves asset sales and dispositions. Take Company XYZ below:
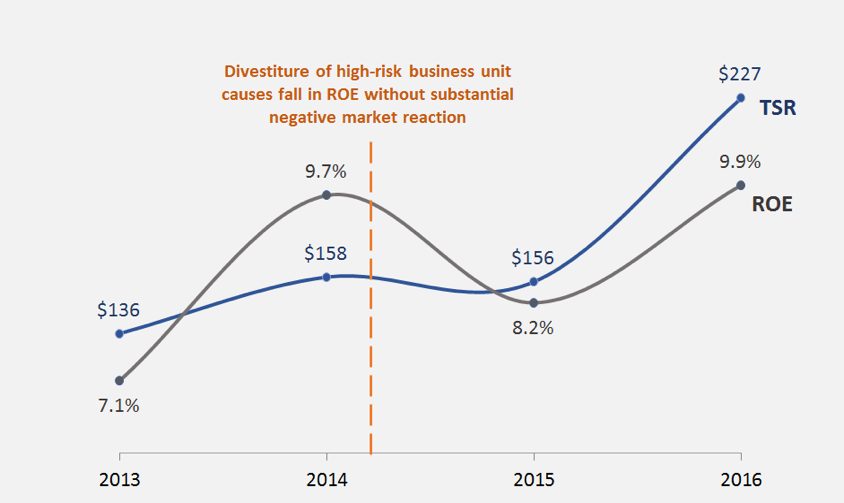
Company XYZ disposed of a high-risk business unit, reducing both income and stockholders’ equity. The hit to earnings exceeded the reduction to equity, contributing to a dip in the 2015 return on equity. But the market reacted positively to the transaction because it perceived it as an effort to de-risk and shift away low-growth revenue sources. These sorts of cases abound in practice.
We don’t see a clean and easy approach ISS can take to address these risks, so our goal in raising them is merely to create awareness as to why FPA results may not match TSR results or the story that’s being conveyed to the street. Therefore, as these policy changes come down the pike, issuers concerned with the ISS criteria should consider doing the following. We’re happy to help.
1. Backtest and estimate your FPA test results. You should be able to come very close with backtesting and reasonably close on a prospective basis. At a minimum, you’d be able to see how your ratios stack up to those of peers for fiscal year 2017 as soon as financials become available.
Think about what the results mean and why there is or is not dispersion among the peers. Suppose your TSR is quite high relative to peers but your financial performance is low. Why is that? This is where we begin reviewing analyst data, forward-looking guidance, non-GAAP metrics, and other resources.
2. Develop an alternative lens. If the implications of ISS’s FPA test do not tightly capture your performance story, then the next step is to figure out which metrics do. One branch in accounting research looks at earnings response coefficients (ERCs), which measure how equity prices react to positive or negative earnings surprises. This science can be used to statistically glean which financial metrics best explain movements in your stock price. This vein of analysis can also look at whether non-GAAP metrics more closely explain security price movements.
Another type of analysis is to disregard the peer group and assess the financial metric on an absolute basis. For example, you could look at whether the return on invested capital (ROIC) exceeds the company’s weighted average cost of capital (WACC). For a firm without solid peer firms, this absolute frame could be more insightful than a relative one.
Using these types of analyses, the goal is to determine whether an alternative lens more effectively conveys the company’s performance story. If so, the final question is how and where to present that alternative picture.
3. Determine how you might adjust your proxy language. For example, the FPA test may motivate you to devote more energy in telling your financial performance story the way you think best. This could involve using non-GAAP versions of the same metrics or altogether different financial metrics.
Solidifying your version of the story and how you will present it in the proxy will assist when speaking to investors who subscribe to ISS’ products, as it lets you speak more concretely about why your perspective is more appropriate. At the same time, consider visualization methods for driving the key points home.
