Subscribe to Our Newsletter
Hear more from Equity Methods: Your trusted partner in equity compensation excellence.
Relative total shareholder return (rTSR) is the most common metric in performance-based equity programs. We help hundreds of companies every year with these plans, and as a result, we see a wide swath of market practices and outcomes. Over the years, we’ve written extensively about the design and valuation of TSR awards, including factors that can drive fair values higher or lower.
But the market-wide spike in rTSR fair values over the last two years has been different. In this article, we’ll unpack the reasons for this spike and what you can do to mitigate it in your awards.
Longtime rTSR issuers may have observed that the fair values of these awards have increased substantially between 2020 and 2022. This effect may be partially masked for any single company, as values can be noisy from year to year. For example, realized performance in the stub period between the start of the performance period and the grant date can swing values materially up or down, obscuring broader trends. But make no mistake, the rise in values is something occurring systematically across almost all companies.
We put this hypothesis to the test with extensive data. We started with a standard, typical rTSR award design with an S&P 500 peer group and a middle-of-the-road payout schedule. We then tested the award valuation by hypothetically assuming each company in the S&P 500 granted it, and ran Monte Carlo valuation models for each of those 500 companies.
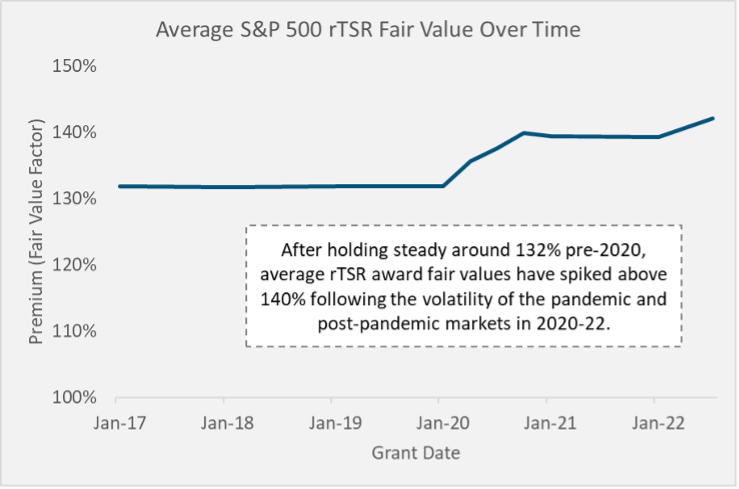
The chart below illustrates the average of the resulting rTSR fair value factors (fair value as a percentage of grant price) for hypothetical grants between January 2017 through July 2022. The results are shockingly clear: After remaining steady for years, values jumped in 2020 and have continued to rise. For reasons we’ll explain later, we expect that these values won’t go down anytime soon. But there are actions you can take to mitigate this rise.
Higher fair values always create drawbacks for someone, though the specific impact depends on how a given company sizes its grants.
Some companies size grants without respect to the fair value of the award. Typically, this means dividing a target award value by the stock price to arrive at a number of units to grant. In this case, a higher value means a higher cost to the company. That in turn means more expense and a hit to earnings. Importantly, if the recipient is a named executive officer in the proxy, the higher value will show up as higher-than-intended disclosed compensation, potentially leading to investor backlash.
Other companies size grants using the fair value. In other words, they divide the target award value by the Monte Carlo fair value to arrive at a number of units to grant. This approach solves the expense and disclosure concerns by fixing those values to the targeted amount. However, a higher value means fewer shares granted to the employee. This may not fly with participants as it’s entirely outside of their control and GAAP rules can seem inscrutable. The smaller grants can create retention or engagement concerns in any case.
All else being equal, lower fair values mutually benefit companies and employees.
What’s pushing rTSR values higher? It’s not inflation. Neither is it interest rates, because interest rates affect all of the peer companies equally in rTSR valuation models. Instead, the main culprit is volatility.
Our first clue is in the chart of fair values above. The first increase happened shortly after the start of the Covid-19 pandemic in early 2020. The sharp decline in stock prices beginning in March of that year caused stock price volatilities and correlations to change substantially. Volatilities (and correlations, to a lesser extent) are significant drivers of relative TSR fair values.
The charts below are before-and-after snapshots of volatilities among S&P 500 companies, taken from January 2020 and January 2021 to capture each side of the 2020 market turmoil.
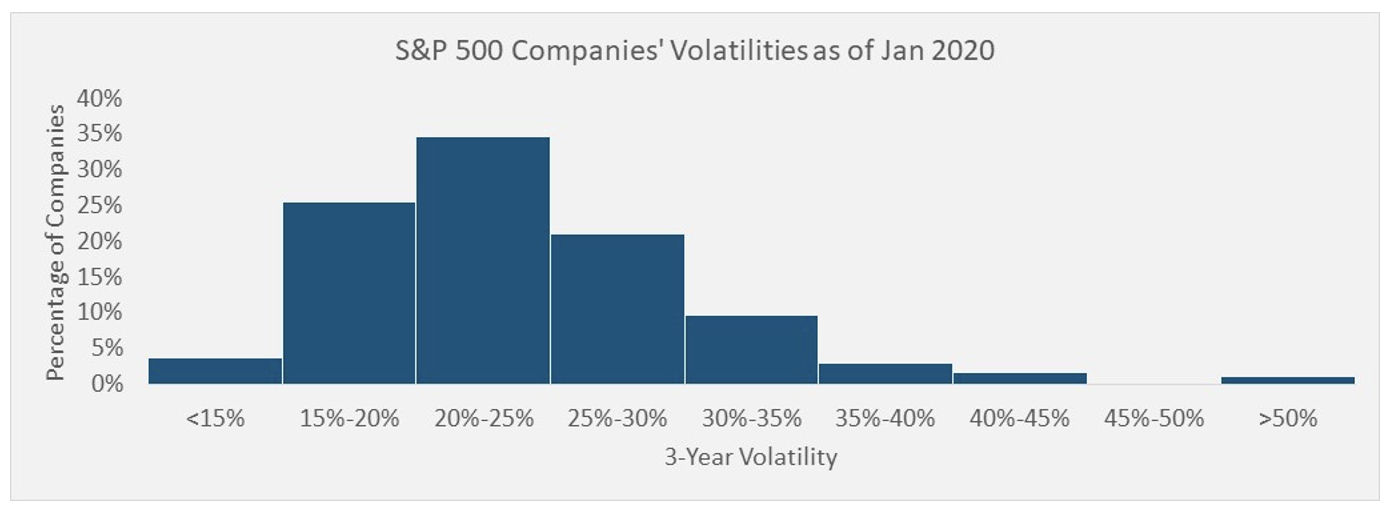
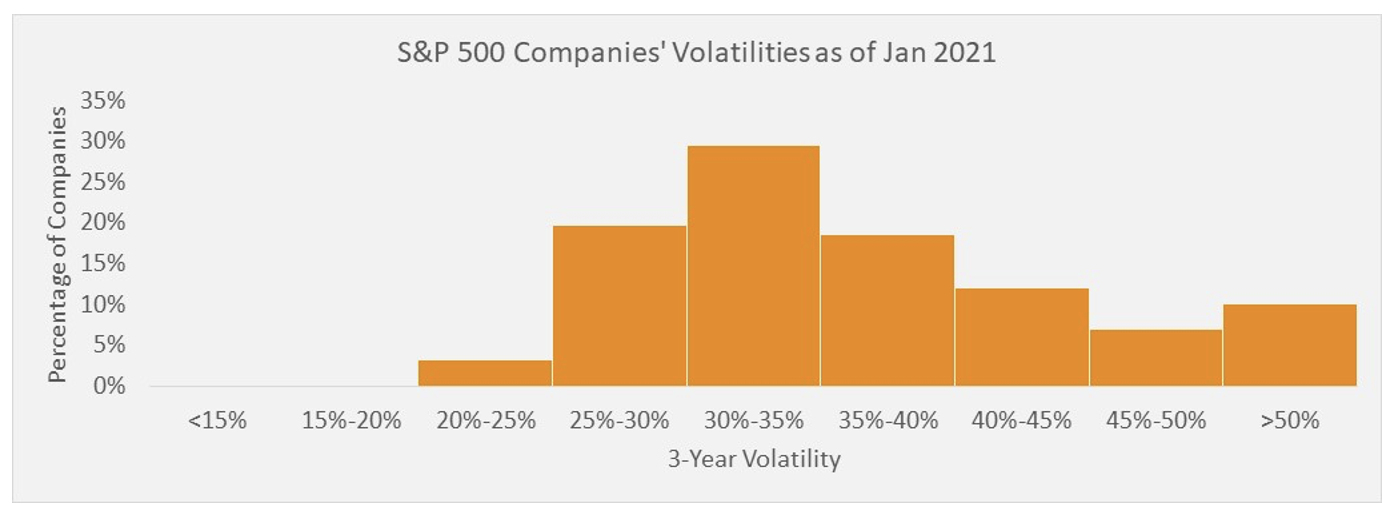
Pre-2020, a majority of companies in the index have a volatility under 25%. A year later, the share of companies under 25% is in the single digits. A substantial number of companies now have volatilities above 40% or even 50%, numbers that used to represent extreme outliers. While this analysis focuses on the S&P 500, we’ve seen volatilities go up across the entire market.
Volatility increases Monte Carlo values for rTSR awards for the same reason it increases Black-Scholes values for options. Namely, a higher volatility means a wider range of outcomes. While the downside is always limited to a floor of zero, the wider range means the highs get higher. Those high-end outliers pull the average value upward. (We’ll have more later on how you can mitigate this effect in your award design.)
A final important lesson from the volatility increase is that this isn’t a short-term problem that will resolve quickly. The reason is that volatility for GAAP valuations is calculated over a historical lookback period commensurate with the award’s performance period. Since rTSR awards commonly have three-year performance periods, the volatility will remain elevated for three years after the market volatility calms down—which it has shown no signs of doing in 2022.
To illustrate, the chart below shows how a three-year volatility has moved over time for a large consumer staples company. While the numbers will differ for every firm, the pattern is the same.
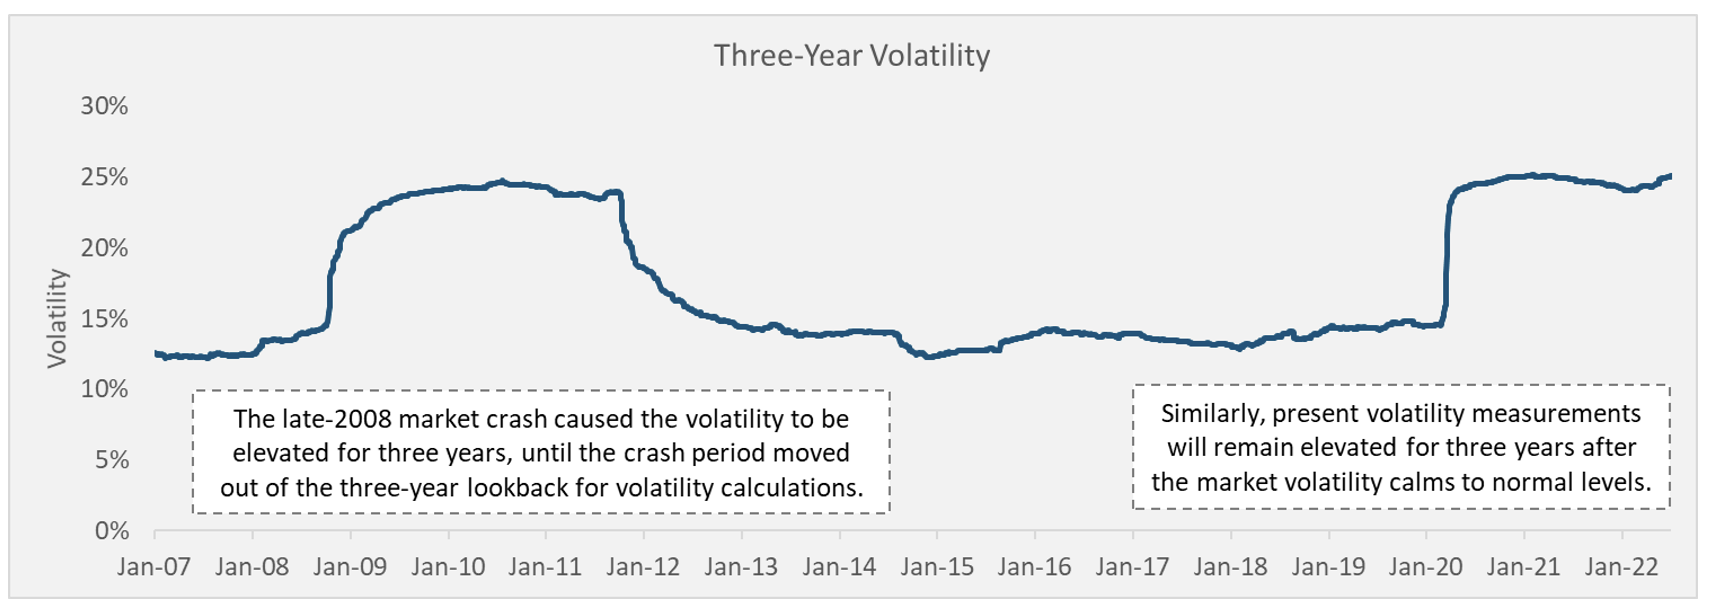
As you can see, the three-year volatility measure was affected by 2009 market activity until 2012. We wrote about this lingering volatility effect back then, and we expect a repeat with the current volatility. Even if the market normalizes tomorrow, the elevated volatility will remain until 2025.
As the old adage goes, there’s no free lunch. Since volatilities and correlations are based on historical price observations, there’s little leeway in calculation methodology. (We welcome discussions with our clients about how to take advantage of the leeway that does exist, but the effect is typically limited.) Ultimately, in order to reduce an award’s fair value, the future payout must be limited in some manner. The key to an effective design strategy is to limit future payouts in a way that the valuation model sees as meaningful but that have the least perceived “take-away” from participants.
We analyzed the effect of three key design levers:
Let’s zoom in on one sector, financials, to weigh the effect of these design levers.
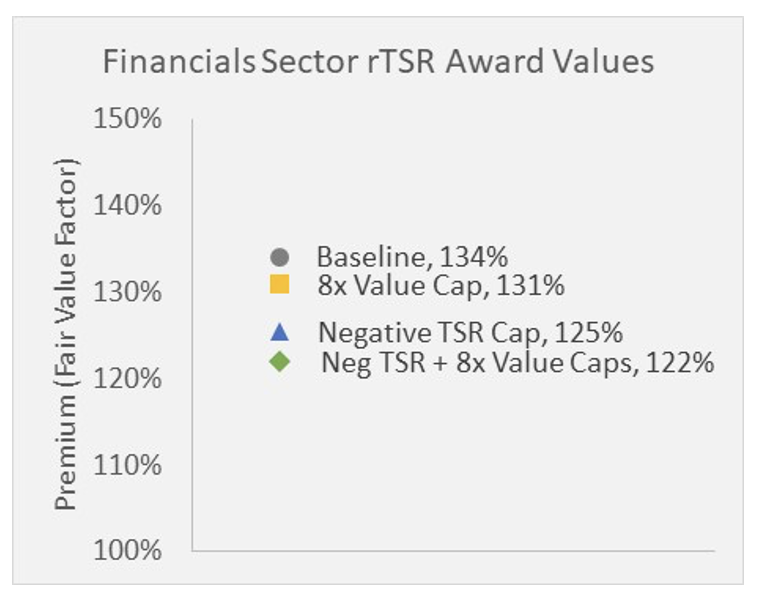
As the chart shows, the baseline value factor for a financials company using other financials companies as peers is 134%. This means that narrower peer selection is already a major factor, since an S&P 500 award would be at 142%. For an average financials company, an 8x value cap decreases the value factor by about 3% and a negative TSR cap decreases the value factor by about 9%. (Exactly how much these caps affect value will vary by company.) Combining the two caps combines the fair value effects. The net result is that the caps reduce the value by 12% from the industry baseline and by a whopping 20% when combined with focused peer selection.
We repeated this analysis across all sectors to see how effects vary.
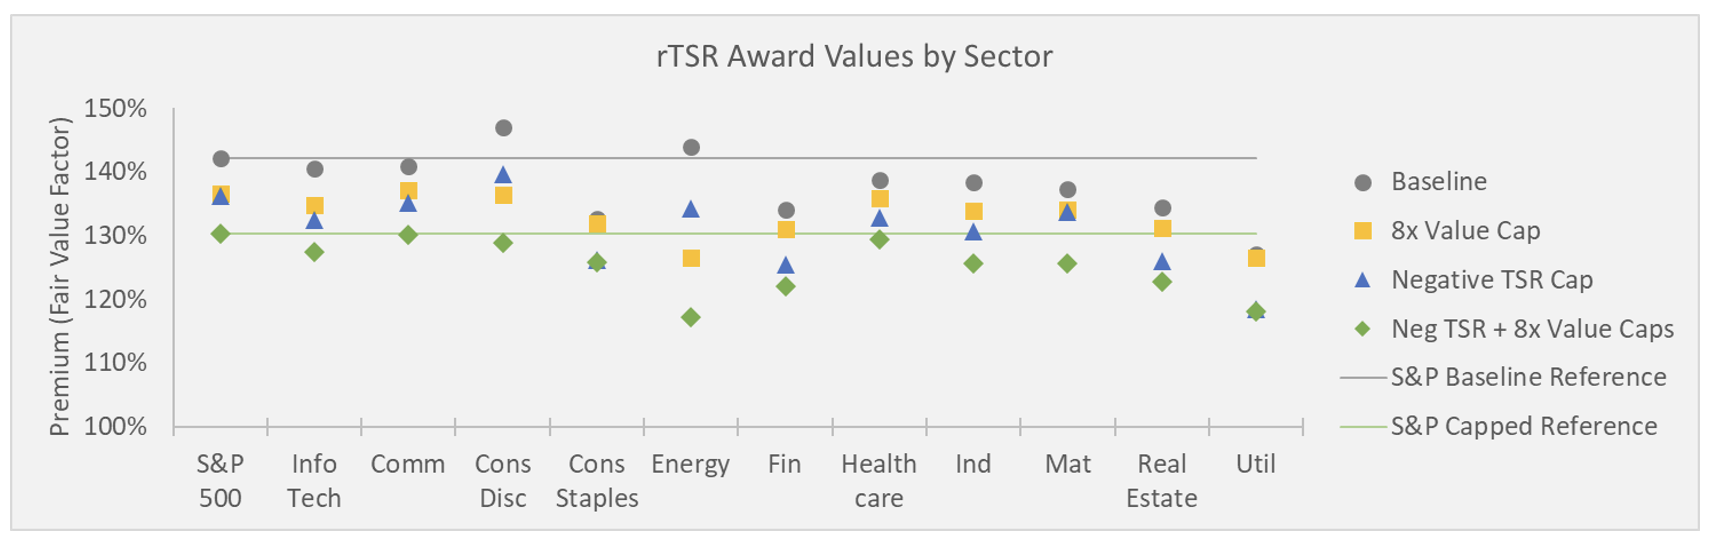
While the effects are different from sector to sector—and indeed, would be different from company to company—there are some key patterns we can learn from.
First, peer selection really matters. For almost every sector, the baseline value using sector peers is lower than the value using the broad S&P 500 peers.
Second, the effect of caps differs by sector. In a lower-volatility sector like consumer staples or utilities, the range of savings is rather narrow (though the fair values are also lower to begin with). In higher-volatility sectors like energy, the effect of the caps on the values can be enormous.
Third, the specific effects of one type of cap versus the other vary widely. For this reason, we’re strong proponents of modeling various design features in the specific context of your company and your award. There’s no one-size-fits-all solution, but with some basic testing, you can find opportunities to get bang for your buck.
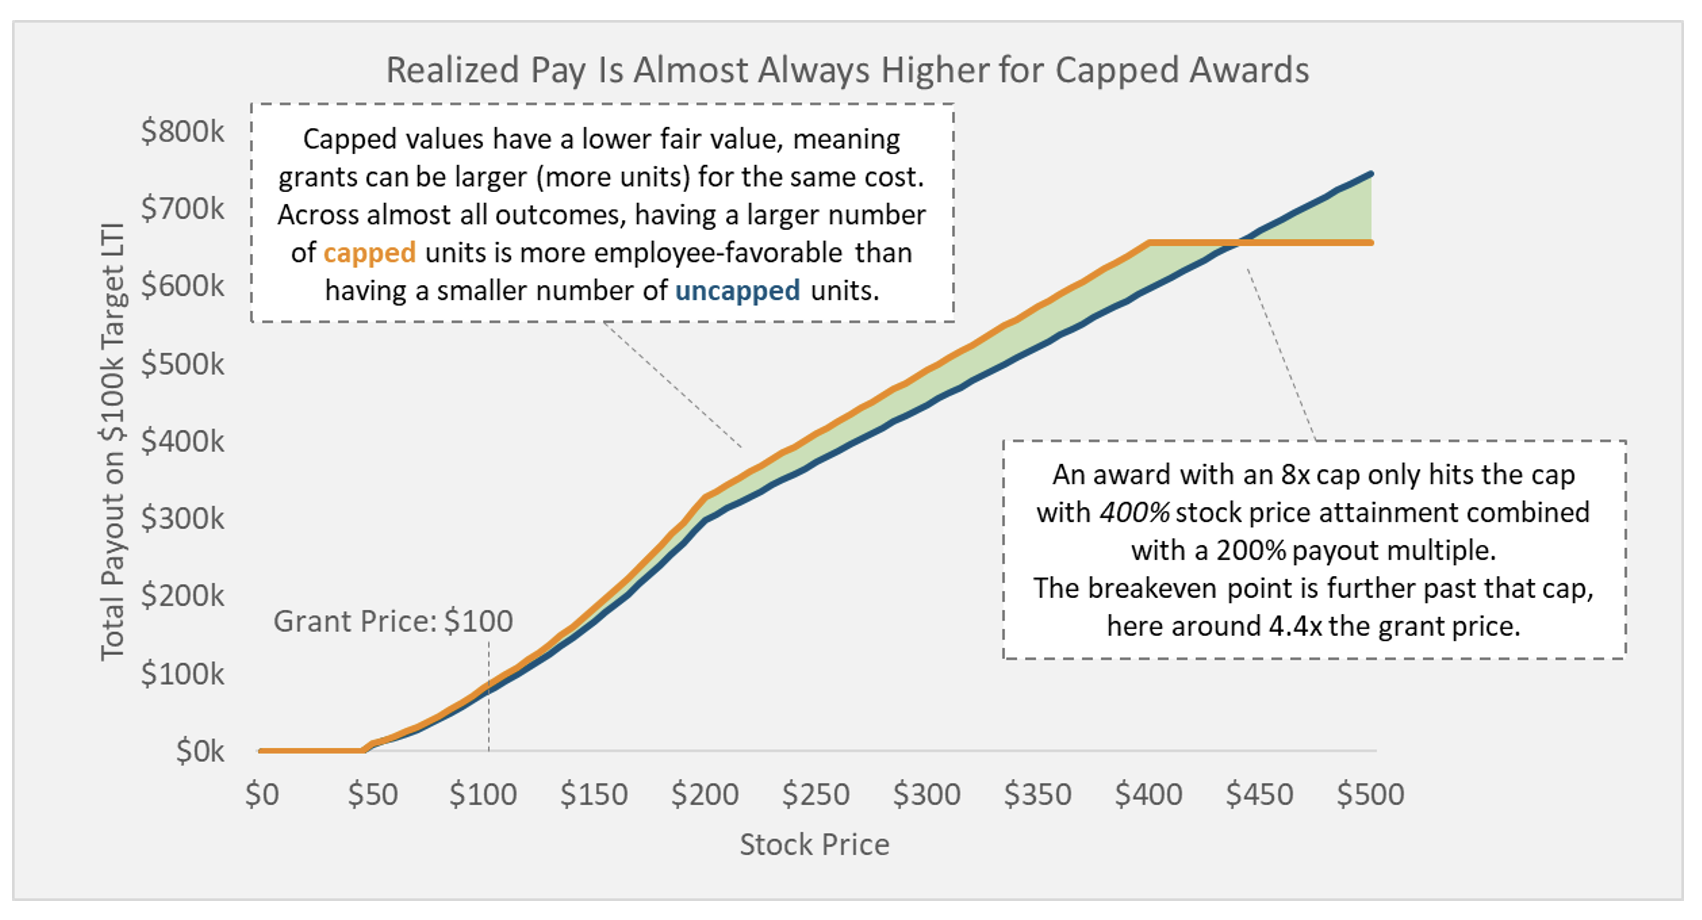
When the topic of overall value caps comes up, the most common objection goes something like this: “Gosh, I understand that the value would come down, but I don’t think our executives would buy into it. Even if the extremely high outcome is unlikely, it’s still possible…and they don’t want to be punished for doing very well. There’s just not much in it for them to go along with this. It’s a take-away, even if an unlikely one.”
There’s some truth to this objection, but it misses the bigger picture. The cap is a take-away on a per-share basis. But that objection ignores the number of shares, and therefore can get the conclusion completely backwards.
The key is that the cap leads to a lower value, and that lower value leads to a larger number of target shares granted. That larger grant means recipients are almost always better off. There may be a take-away in extreme circumstances (circumstances where everyone gets huge payouts anyway), but that take-away is balanced by a tangible benefit in all but those extreme circumstances.
High rTSR fair values have been a reality in recent years and will likely continue for a few years to come. Rather than passively accepting the costs this imposes on companies and recipients, there are win-win actions you can take with your award design. What’s more, the design changes can be relatively small tweaks that don’t require throwing everything out and starting from scratch.
As we head into the fall planning season for next year’s grants, take a critical look at your award and how values have trended in recent years. Model out the effect of different plan refinements, like peer selections and caps, to get a sense of how much extra juice you may be able to squeeze. For a holistic picture that maximizes buy-in, make sure your modeling doesn’t narrowly view valuation on its own, but how that value interplays with realizable pay.
If you would find it helpful to discuss these or any other ideas about your rTSR awards, please contact us.
