Subscribe to Our Newsletter
Hear more from Equity Methods: Your trusted partner in equity compensation excellence.
or “Why are we still talking about the financial crisis?”
“It ain’t over till it’s over.”
–Yogi Berra
Starting in 2015, most companies began shedding the volatile stock price movements of the 2007 to 2010 recession from their calculations of historical volatility. Because of the way volatility works, a single period with excessively high volatility can have an outsized impact on the value of option grants, in that period and for years to come. Over the next few years, option valuations for many companies may witness a graduated decline.
This is important to compensation and finance professionals alike because of the considerable role accounting valuations play in equity compensation granting strategies. Declining award costs allow more units to be granted for the same aggregate cost, whereas inflated award costs can cause recipients to receive fewer units than expected or result in negative proxy surprises in the summary compensation table.
Here we discuss the three volatility measures typically used to value employee stock options, and illustrate how the volatility spike from the financial crisis is tapering off now that we are six years past its end. Further, we discuss the impact of declining volatilities on option valuations and overall grant practices. Finally, we briefly introduce some of the other levers in a stock option that can be adjusted to influence the overall valuation.
As companies move forward into 2016 and beyond, this is a good time to reassess volatility estimation methodologies, as well as other valuation and award design levers through which greater value can be delivered to award recipients without creating negative cost surprises.
Volatility is a measure of the dispersion of stock price movements, or the variability of returns. Companies with low volatility, such as regulated utilities and other blue chips, are expected to grow slowly, but steadily, over time. On the other hand, the stock prices of higher volatility companies (e.g., start-ups) can move significantly from one day to the next.
Companies use three measures to estimate their volatility for financial reporting. The first, historical volatility, refers to the actual variability in movement of a stock over a specified historical period. The second measure, implied volatility, is the volatility figure that generates the actual trading price of market-traded options (think of it as the market’s “consensus” estimate on a company’s expected future volatility). A third measure, used primarily by private or newly public companies, involves calculating the historical (or implied) volatilities of a basket of peer companies.
Implied volatility is rarely available for terms similar to employee stock options and other long-term derivatives. Neither is it available for all companies. It’s also subject to short-term market fluctuations. For these reasons, most companies with usable option data rely on a blend of historical volatility and implied volatility. Many companies rely exclusively on historical volatility, usually due to a lack of usable option data, and a small percentage also use implied volatility as their exclusive measure.
Nothing new so far. But what has our attention is how the financial crisis is affecting employee stock option valuation today, and how that is set to change for many companies soon.
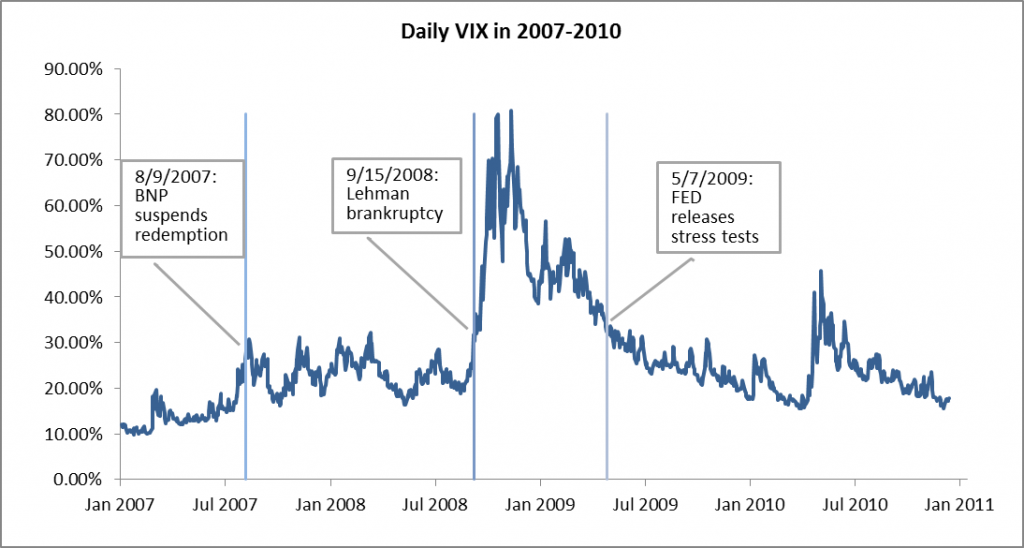
The volatility during the financial crisis was unprecedented. The following graph shows the daily VIX, a measure of implied volatility for the S&P 500, from 2007 through 2010. It reveals the dramatic jump in volatility during that time. We’ve highlighted a few dates on this graph:
These dates roughly reflect the start, peak, and end of the financial crisis.
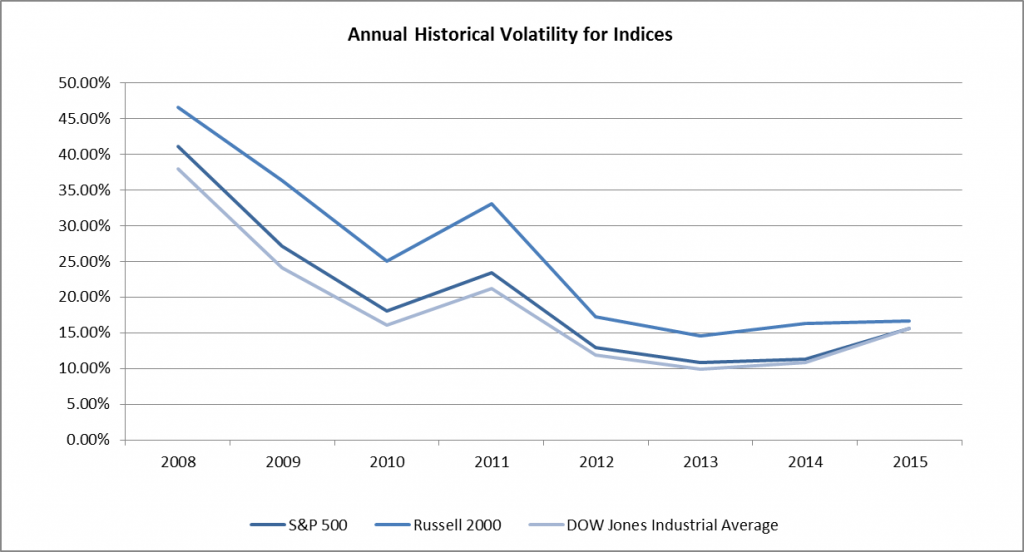
The next graph shows the annual historical volatility for several key indices. Again, this reflects the greater volatility during the crisis period.
The higher the volatility, the higher the fair value. Volatility is a key assumption in any option pricing model. It means that, for new at-the-money grants, accounting values actually increased during the financial crisis relative to the value of underlying stock. Now that these extreme price fluctuations are exiting many calculations of volatility, we are seeing option values decline for many companies that lean on historical volatility as a model input.
Suppose a company has common stock priced at $10.00 per share. The firm issues at-the-money employee stock options which have a seven-year term. The firm pays no dividends, the volatility of the firm is 40.00%, and the risk-free rate is 1.50%. In this case, a standard Black-Scholes formula results in an option fair value of $4.35. If the volatility of the firm decreases to 30% while the other assumptions stay the same, then the option’s value plunges 21% to $3.45.
The two tables below display the volatilities of companies currently in the Dow Jones Industrial Index, separated by financial and non-financial companies. All companies show a declining trend in volatility as the financial crisis recedes. Not surprisingly, the volatility fallback among financial companies is comparatively larger. On average, it declined by almost half, from 46.10% during 2008-2014 to 26.28% during 2010-2015. In comparison, the average volatility of the non-financial companies declined about a third, from 29.32% to 20.50% over the same periods.
|
Financial Companies in DJIA |
|||
| Company | 2008-2014 | 2009-2015 | 2010-2015 |
| American Express | 47.60% | 37.62% | 24.44% |
| Goldman Sachs Group | 47.32% | 35.68% | 27.43% |
| JPMorgan Chase | 53.47% | 41.67% | 27.74% |
| Visa | 36.02% | 28.89% | 25.52% |
| Averages | 46.10% | 35.97% | 26.28% |
| Non-Financial Companies in DJIA | |||
| Ticker | 2008-2014 | 2009-2015 | 2010-2015 |
| Apple | 35.91% | 27.89% | 26.75% |
| Boeing | 32.95% | 27.55% | 24.06% |
| Caterpillar | 38.08% | 32.92% | 27.26% |
| Cisco | 34.55% | 28.99% | 27.08% |
| Chevron | 30.40% | 21.76% | 21.02% |
| Du Pont | 32.99% | 27.27% | 22.67% |
| Disney | 31.98% | 25.85% | 22.22% |
| General Electric | 37.82% | 30.70% | 22.63% |
| Home Depot | 31.23% | 23.77% | 20.60% |
| IBM | 24.11% | 20.34% | 19.14% |
| Intel | 32.70% | 26.08% | 23.66% |
| Johnson & Johnson | 17.77% | 14.36% | 14.09% |
| Coca-Cola | 21.26% | 16.79% | 15.22% |
| McDonalds | 20.49% | 15.88% | 15.22% |
| 3M | 25.36% | 21.67% | 18.96% |
| Merck | 29.50% | 22.53% | 19.46% |
| Microsoft | 31.11% | 25.24% | 23.32% |
| Nike | 31.90% | 26.09% | 23.46% |
| Pfizer | 25.51% | 21.37% | 18.70% |
| Procter & Gamble | 19.86% | 16.13% | 14.26% |
| Travelers Companies | 35.30% | 23.01% | 18.41% |
| UnitedHealth | 40.79% | 30.04% | 24.02% |
| United Technologies | 27.90% | 22.38% | 20.31% |
| Verizon | 24.67% | 18.23% | 16.29% |
| Walmart | 20.40% | 16.11% | 15.74% |
| Exxon Mobil | 27.88% | 19.59% | 18.55% |
| Averages | 29.32% | 23.17% | 20.50% |
Combining periods of intense and low volatility has a more profound impact than you might expect. For example, among the S&P 500 from 2008 to 2015, 2008 has the highest yearly volatility at 41.1% and 2013 the lowest at 10.9%. One might think that the volatility over the combined period would be equal to the simple average between these two metrics, 26.0%. However, this actually results in a volatility of 30.1%.
Briefly stated, volatility is based on the squared difference between the daily returns and the average return. As a result, a single large move can create a seemingly disproportionate impact because the square of the difference is larger. Importantly, even brief periods of elevated volatility can have a very pronounced impact on the overall result even for a long term calculation.
Declining volatility means declining option values. This allows companies to either grant the same number of options at less expense, or grant more options for the same total expense. In other words, stock options are becoming much cheaper to grant, which makes the present an opportune time for companies to consider placing a higher weight on options in their overall portfolio of share-based compensation instruments.
Recall the example above in which a firm’s volatility declines from 40% to 30%. Suppose the company targets total compensation expense at $100,000 with a 50-50 weighting between options and restricted stock units (RSUs). At the original option value of $4.35, the firm would issue 11,494 options and 5,000 RSUs. Due to the reduced option value, it would be able to grant 26% more options at no additional cost. Even companies that have moved away from options might consider making a one-time special grant now that options are much cheaper.
The question often arises as to how much leeway there is in forming a volatility estimate. The answer is that there’s some.
ASC 718-10-55-37 states that companies should consider:
Volatility of the share price, including changes in that volatility and possible mean reversion of that volatility, over the most recent period that is generally commensurate with (1) the contractual term of the option if a lattice model is being used to estimate fair value or (2) the expected term of the option if a closed-form model is being used. (ASC 718-10-55-37)
Expected terms usually range between five and seven years, meaning many companies are still using lookbacks that go back to the financial crisis period. In fact, as a reaction to the financial crisis, many companies used even longer periods to stabilize their volatility calculation.
Excluding time periods from a volatility calculation has rarely been supportable. ASC 718-10-55-37 states:
For example, in computing historical volatility, an entity might disregard an identifiable period of time in which its share price was extraordinarily volatile because of a failed takeover bid if a similar event is not expected to recur during the expected or contractual term. If an entity’s share price was extremely volatile for an identifiable period of time, for instance, due to a general market decline, that entity might place less weight on its volatility during that period of time because of possible mean reversion. (ASC 718-10-55-37)
Some companies have explored ways of weighting one time period more than another, but SAB 107 makes this difficult: “Certain methods may not be appropriate for longer term employee share options if they weight the most recent periods of Company B’s historical volatility much more heavily than earlier periods.” (ASC 718-10-S99-1 FN38)
When we work with companies to develop their volatility estimates, we focus carefully on the historical time period that makes most sense as well as the mix between historical and implied volatility. We even see cases where reducing the weight on implied volatility makes sense because historical volatility has normalized and the quality of quoted options data has declined. Although every situation is different, there’s no time like the present to refine a volatility estimation methodology.
Aside from volatility, there are other levers that deserve mentioning.
Expected term estimation. We’ve published extensively on the importance of using refined and judgment-driven estimates of expected term instead of just pushing buttons in a software calculator. The effect of the recent equity bull market has caused movement in many companies’ expected term estimates, making some of them fall drastically.
Contractual term shortening. Some companies find value in shortening an option contractual term from 10 to 7 years. If employees don’t hold their options for the full term, this shortening can lower the value without imposing additional burdens on the recipients.
Option-like instrument design. Since ISS does not consider options to be performance based, many companies design instruments that essentially mimic the payouts of an option but are technically classified as an RSU with a market condition. It’s certainly worth noting that market vesting RSU’s can have similar reactions to volatility as options.
Performance-contingent options. Some companies have begun adding performance conditions to govern either the number of options that vest or the time that they vest. While this has a very indirect impact on the valuation, it does at least allow options to be classified as performance based.
Discrete periods of volatility play an outsized role in an overall calculation of historical volatility. Now that stock prices from the 2008 recession are being shed, it’s a good time to rethink the role of options in an LTI portfolio and how they are valued.
Here are a few more tips on what you can do about the issue:
If you have any questions about volatility, or any other component of your fair value measurement calculations, let us know. We’re happy to assist.
Don’t miss another topic! Get insights about HR advisory, financial reporting, and valuation directly via email:
subscribe