Subscribe to Our Newsletter
Hear more from Equity Methods: Your trusted partner in equity compensation excellence.
Last updated on May 27, 2023
The SEC released its pay vs. performance (PvP) proxy disclosure rule on August 25, 2022. On February 10, 2023, the SEC released its Compliance & Disclosure Interpretations (C&DIs), which addressed some open questions, created new ones, and left many others unanswered.
As of late May, a majority of companies have successfully published their year-one PvP disclosures. We’re collecting and studying these disclosures to assess trends, best practices, and common omissions. This is our third update to this article, in which we report insights from over 600 PvP disclosures spanning all industries and size levels.
We cover key disclosure strategy decisions as well as common errors or shortcomings we’ve observed in our database. Overall, you’ll see some distinct trends and best practices but also important junctures of company-specific variation. Disclosure quality ran the gamut and this will be an important theme for year two.
As we look forward to year two, looming questions include whether proxy advisors will find a way to incorporate PvP “grades” into their voting recommendations and the sorts of questions to expect from senior management and the board. We’ll comment briefly on these topics, but stay tuned as we pivot our research and writing focus to year two considerations.
Let’s begin with some basic statistics on the filers in this report.
Most filers are classified as large accelerated filers (Figure 1). Non-accelerated filers and smaller reporting companies (SRCs) make up the remainder.
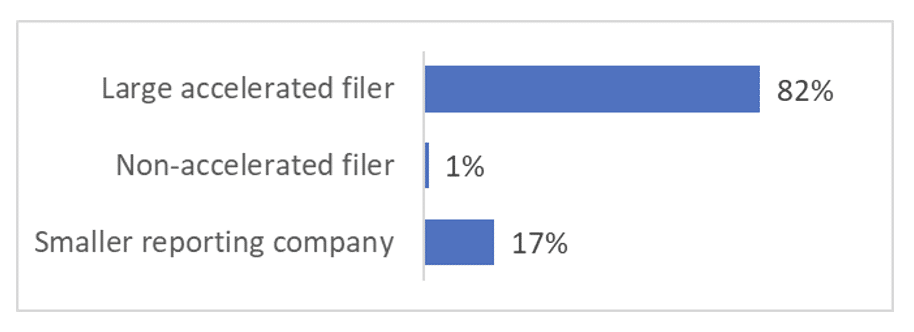
Figure 1: Filer Type
Now that we are further into the year, the makeup of filer types for PvP is largely reflective of the makeup of filer types in the market at large.
Consistent with the filer types, we also have a wide range of market capitalizations (Figure 2).
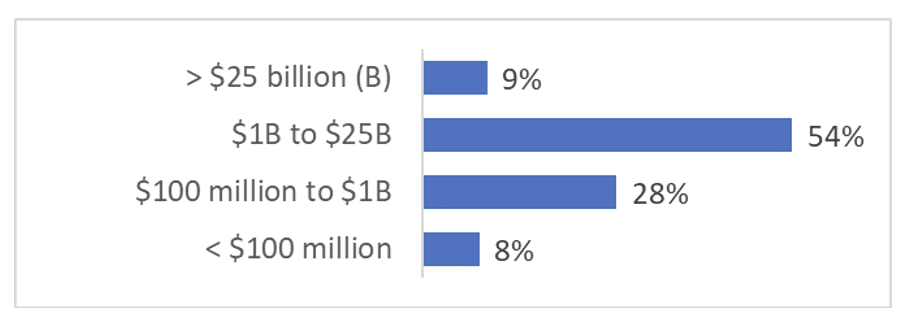
Figure 2: Market Capitalization of Companies
Now let’s look at the decisions companies made where the PvP rule affords flexibility. This includes their choices in peer total shareholder return (TSR) group, the location of the disclosure, and the number of metrics listed in the tabular disclosure.
The PvP rule provides discretion as to where to locate the disclosure within the proxy. The three common choices are:
Most companies go with the third option (Figure 3). (Not all proxies are structured identically, so we made some judgment calls in categorizing some of the disclosures.)
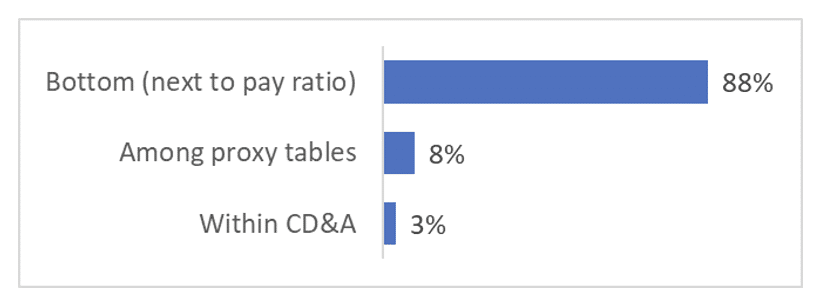
Figure 3: PvP Disclosure Location
It may seem surprising that even 5% of companies chose to place PvP within the CD&A. Our suspicion is these placements were accidental and that we’ll see revisions in future years to locate the disclosure next to the CEO pay ratio disclosure. In a few proxies, it wasn’t even clear from the core language (or table of contents) where exactly the CD&A ended.
Unless a company truly expects to structure pay decisions in the context of insights revealed by their PvP calculations, the CD&A is the wrong place to locate this disclosure. Remember, the CD&A is intended to resemble what you’d hear if you sat in on the compensation committee’s discussions about how to set and structure executive compensation. While committees are obviously looking at PvP disclosures, we’re unaware of any that are changing the number of metrics or shifting quantum up or down based on the outputs of their PvP calculations.
Initially we thought a reasonable disclosure location would be alongside the other proxy tables. If the summary compensation table explains the value at grant, it could be logical to cover PvP immediately after that since PvP explains the value evolution post-grant. However, there are two problems with this thinking. First, most companies have rejected the idea that PvP explains value evolution since the information is such a broad amalgamation of new awards, in-flight awards, and settling awards. With so many moving parts, the disclosure is noisier than a classic realized pay disclosure.
Second, while Item 402 of Regulation S-K doesn’t create a direct connection between the CD&A—which is Item 402(b)—and the detailed tables, there’s some presumed implicit connectivity between the two. This motivates companies to locate PvP as far down as possible to visually demonstrate the separation from the CD&A.
A second decision is whether to provide a supplemental disclosure. We generally advise against doing so unless there’s a unique and specific message to deliver. Any supplemental disclosure is subject to three criteria:
Consistent with expectations, Figure 4 shows that very few companies elect to provide a supplemental disclosure.
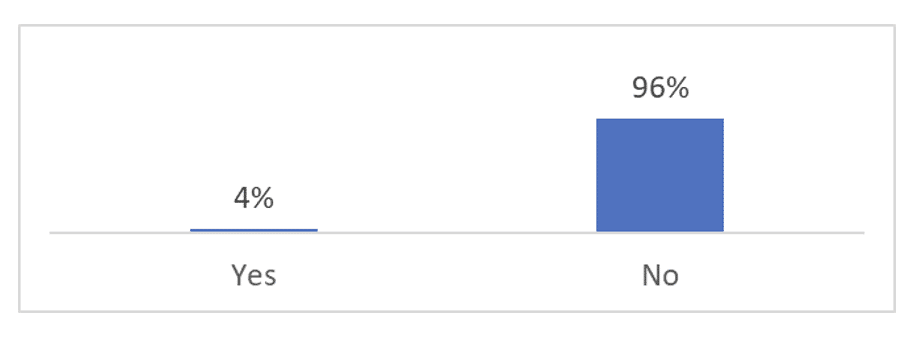
Figure 4: Supplemental Disclosure
The SEC’s three criteria introduce risk. For example, one company that provided a supplemental disclosure added commentary explaining why the PvP framework is less insightful than a classic realizable pay model, and even bolded this paragraph. If presenting a supplemental disclosure, be sure it’s labeled as such, is not more prominent than the required content (e.g., bolded), and is not misleading (e.g., in direct refutation of PvP).
We’re often asked to define “misleading.” A statement is misleading if it directly contradicts or undoes the construct that the core PvP rule requires, or if it waffles between different constructs over time. The SEC’s C&DIs on non-GAAP metrics provide a flavor for how they think about the definition of misleading.
Finally, bear in mind that there isn’t a bright line delineating what qualifies as a supplemental disclosure. For example, Dow provides relationship disclosures using both compensation actually paid (CAP) and SCT pay. We presume that in a room of 10 experts, five would call this a supplemental disclosure and five would not. Therefore, a good rule of thumb is that any disclosure deviation from the strict requirements should be clearly labeled as supplemental and not presented more prominently than the required content.
While SRCs are exempted from selecting a peer group whose TSR they compare to their own, all non-SRC filers must do so. The final rules allow companies to use any non-broad index used for Item 201(e) purposes or the CD&A peer group.
There’s been no shortage of controversy here. For example, the PvP rule points to the index or group of companies selected under Item 201(e)(1)(ii), which excludes any broad market index. Broad market indices are allowed under Item 201(e)(1)(i), which isn’t listed anywhere in the PvP rule. Similarly, there’s been confusion as to the suitability of different peer groups disclosed in the CD&A, such as peer groups not explicitly flagged as having been used for benchmarking or a peer group used within a relative TSR award. The SEC partially addressed these topics in its recent C&DIs.
As anticipated, most companies choose to use their Item 201(e) group (Figure 5). This is simpler and easier to roll forward than using the CD&A peer group. We separated the CD&A group between the regular group used for compensation planning and the TSR peer group, should such a group exist and be different from the regular CD&A peer group.
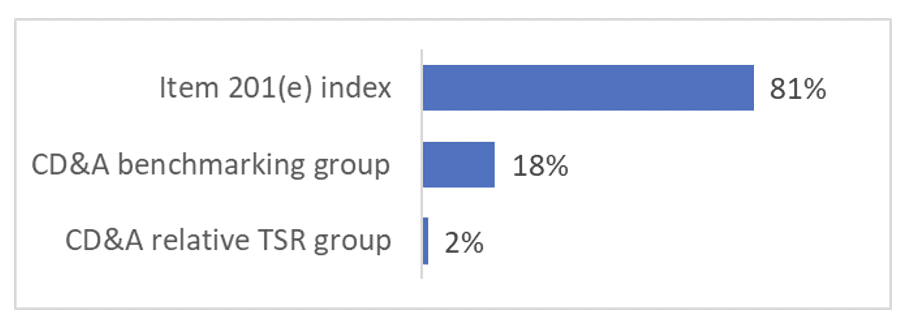
Figure 5: Peer TSR Group
We also found multiple instances in which a broad index like the S&P 500 was used. Sometimes this was due to that being the only index disclosed in the stock performance graph of the 10-K. Even so, this creates risk and may merit the inclusion of a line of business or similar specialized peer group in next year’s stock performance graph.
The Tabular List is required under Item 402(v)(6), which instructs companies to provide a list of at least three, and up to seven, performance measures that are used in the current year’s incentive plans. At least three must be financial performance measures. Non-financial measures are allowed, but only after three financial measures are listed; if there are fewer than three financial measures, then those should be listed. If there are no financial measures, then there will not be a tabular list. SRCs are not required to produce a tabular list.
Most companies provide the minimum number of financial metrics and disclose either zero non-financial metrics or only one (Figure 6).
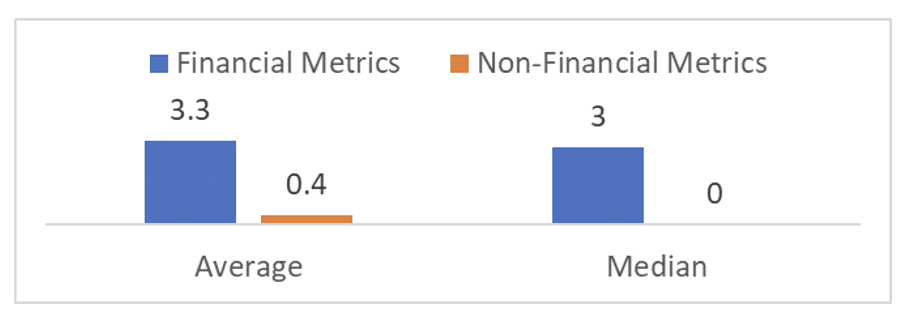
Figure 6: Metrics Disclosed in the Tabular List
The Tabular List is a required disclosure except when it cannot be compiled because the criteria aren’t satisfied. A company without any financial performance measures in its annual or long-term plan won’t have a Tabular List. Otherwise, it should be mechanically constructed based on the metrics present. From our sample, 9% of companies who aren’t SRCs omitted a Tabular List without explanation.
Non-financial metrics are allowed in the list, but only after three financial metrics are included. In our sample, 11% of companies included at least one non-financial metric despite not including at least three financial metrics.
Non-financial metrics are uncommon because many companies lack objective, measurable non-financial metrics in their incentive plans. Even if they have them, these metrics may have a low weighting such that their inclusion in the Tabular List could feel contrived. Other companies seize the opportunity to signal their commitment to ESG (or similar) metrics and include them regardless of the weighting.
Kimberly-Clark is a good example. They list four financial and two non-financial metrics in their Tabular list. They also provide a brief explanation, which is not required but helpful since it’s not obvious what the two non-financial goals mean.
We studied the selection and use of company-selected measures (CSMs) in a few ways. First, we looked for companies that are required to disclose one, but choose not to for one reason or another (Figure 7). The rules are clear: a CSM is required for non-SRCs unless no metric meets the requirement of being a financial metric used in the current year’s incentive plans.
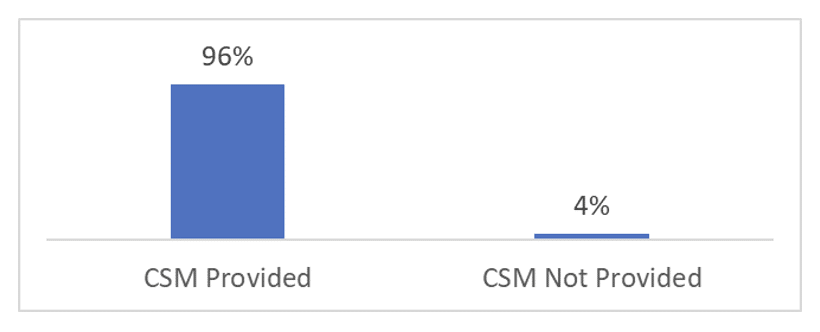
Figure 7: CSM Disclosure (for Non-SRCs)
One reason for not providing a CSM is having a stock option-only incentive program and no annual bonus plan (or at least not one with financial performance metrics). In this case, there simply isn’t a suitable CSM since stock price is not allowed unless it is an explicit metric in the incentive plan. When there is not a suitable CSM, we suggest explicitly disclosing this instead of going silent on the matter. A good example of this is Solid Power.
The next item we looked at is the type of CSM disclosed. Since metric labels run the gamut, we categorized them into our usual group of sales, earnings, return, cash flow, and stock price metrics (Figure 8).
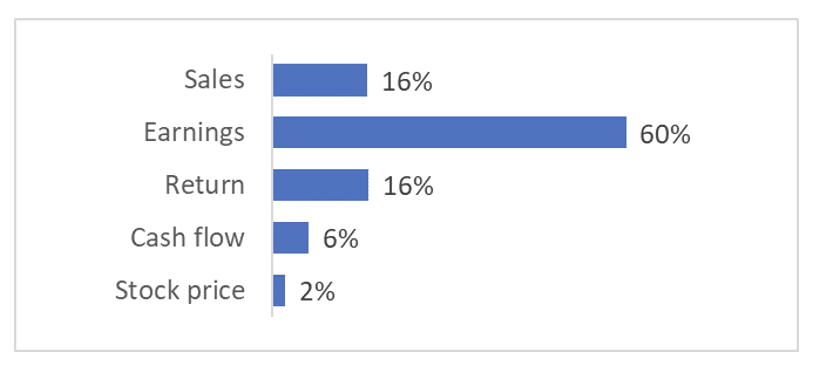
Figure 8: CSM Metric Types
We’ve spoken to many companies that were planning to base their CSM decision on a prevalence graph like this one. That’s not really the best way to approach CSM selection. The CSM is the “most important” financial metric in the current year’s incentive programs explaining movement in CAP.
In our client engagements, we start with an assessment of what management and the committee believe is the most important metric. This is primarily a quantitative exercise since the board may “like” their earnings metric but assign revenue much more weight. Then, we take to graphing a few metrics to gauge visually which one is most closely correlated with movements in CAP and will therefore best articulate the pay for performance story.
It may be surprising to see stock price metrics bringing up the rear, especially given that over 70% of companies use relative TSR in their long-term incentive plans. Many companies are confused by the SEC’s guidance on using relative TSR as their CSM. Would this be too similar to the TSR metrics already in the PvP table? Would it be confusing (or even allowable) to display a one-year relative TSR metric as the CSM now that three-year metrics are not permitted? These concerns have clearly prompted a shift toward simpler accounting-based metrics.
Item 402(v)(5) relationship disclosures have emerged as one of the most hotly debated areas during the final few steps of preparation. We covered the topic extensively in a three-part blog series (see part 1) and webcast. We have a slight bias toward graphing because the PvP rule has no bright-line explanation of what constitutes an adequate narrative disclosure. Because graphing is a sufficient condition to compliance, it can be done on its own or in concert with targeted narrative prose that drives home a specific point or theme.
As expected, few companies adopt a narrative-only approach. A majority adopt a graph-only approach (Figure 9). The ideological lenses of management teams and their advisors explain these differences. Many companies fastidiously want to do the minimum and nothing more, whereas others wish to explain and contextualize.
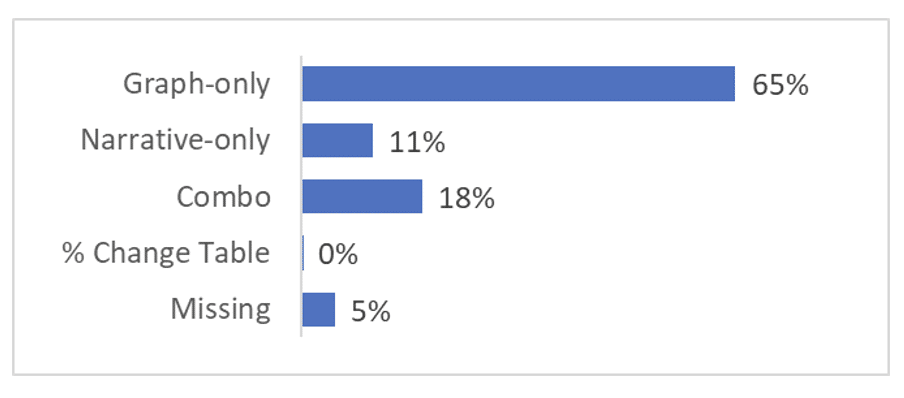
Figure 9: Relationship Disclosure Approaches
Nearly all companies using graphing adopted the dual axis construct referenced in the PvP rules. Different companies render graphs differently, some being clearer and more elegant than others. Oddly, we were surprised to see some graphs that appear fuzzy and are largely illegible, which could be an area of SEC inquiry or general investor frustration. Be sure to conduct a final review of the visual proxy content to ensure image resolution and clarity were not degraded in the final preparation stages.
The “missing” cases are ones where the company provides no relationship disclosure of any type as required by Item 402(v)(5). These are generally smaller companies, but are nonetheless likely candidates for an SEC comment letter.
Are there any arguments for adopting a narrative-only approach? Absolutely. It may be that narrative explanation downplays problematic PvP relationships whereas a graph accentuates them. The most problematic relationship is one where TSR is declining and CAP is increasing. It’s hard to imagine the net income relationship mattering, but one would expect to see a reasonable correlation between CAP and the CSM.
We also studied the narrative disclosures and classified them into one of four categories: deep analysis, shallow analysis, percentage change, and textual table (Figure 10). A shallow analysis briefly repeats information already present in the disclosure and a deep analysis offers up new information and insight. A percentage change approach illustrates the slopes across PvP table variables, thus offering an extra layer of insight and clarity without being a full-blown analysis. A textual table involves almost direct repetition of the PvP table but uses sentences.
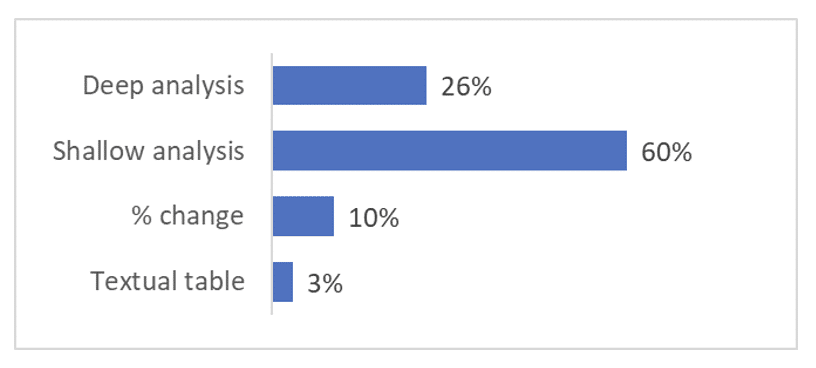
Figure 10: Assessment of Narrative Relationship Disclosures
Note that many of these are combo cases where the bar for how much narrative to provide is nil because the graphing already checks the compliance box. For this reason, we also studied the narrative-only cases and found the percent of shallow analysis disclosures fell to 46%. IBM offers a good example of a narrative-only disclosure.
Every company faces a decision of how detailed their PvP disclosure should be. Some of this decision may depend on the templates they used or how complicated their situation is (e.g., the presence of pension programs). But if word count is any indication, non-SRCs file more complex disclosures across the board (Figure 11).
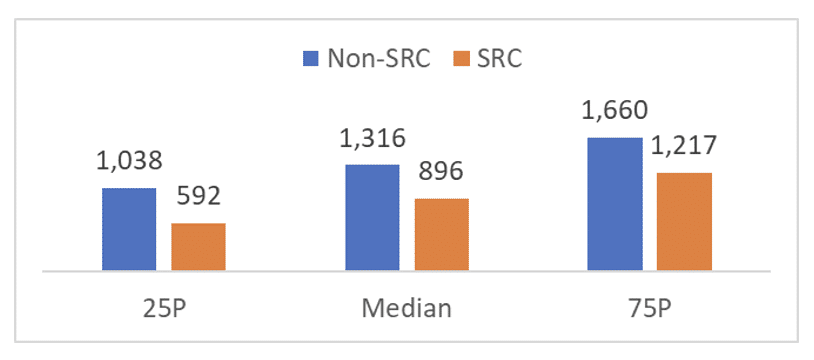
Figure 11: Disclosure Density as Measured by Word Count
It’s understandable that SRCs will have shorter disclosures. A disclosure of fewer words may still be lengthy due to the graphs. We suggest focusing on the style and story, and not worrying too much about length as long as it’s within the general bookends of Figure 11.
Although the PvP rule affords considerable flexibility, some of its components are prescriptive and there are not competing interpretations. As we collect disclosures, we’re working to identify common errors so that later filers can improve their disclosure quality. None of this is to suggest that the disclosures are harmful or misleading. We offer these points in the spirit of improvement and refinement.
In December 2022, the SEC gave a talk on how they expect companies to disclose the six sub-components used to calculate CAP for equity awards:
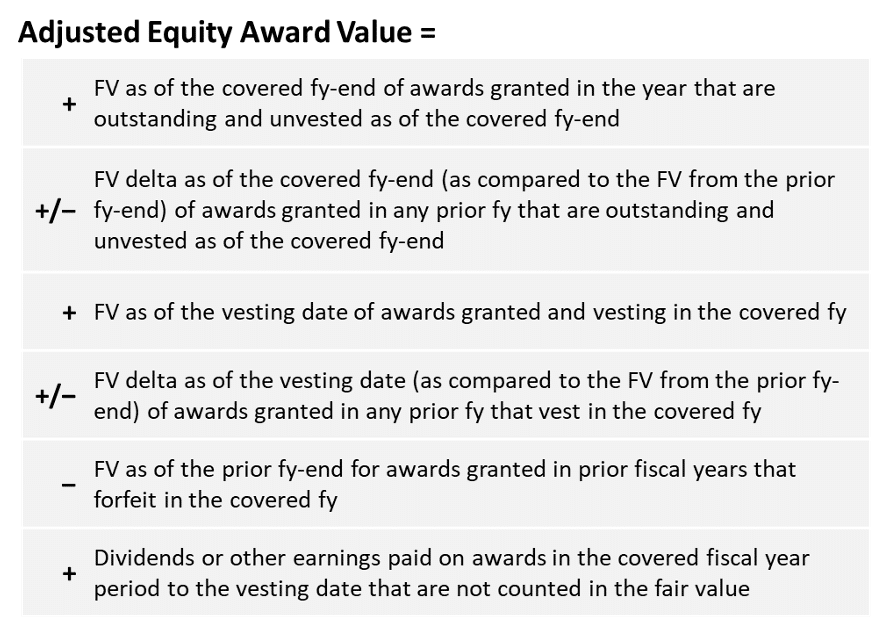
The SEC confirmed this perspective in Question 4 of its C&DIs. We automate this process for our clients, but it may be tougher to get to this level of granularity if using spreadsheets to perform the calculations.
So far, over a fifth of filers omit the granular equity calculations required (Figure 12).
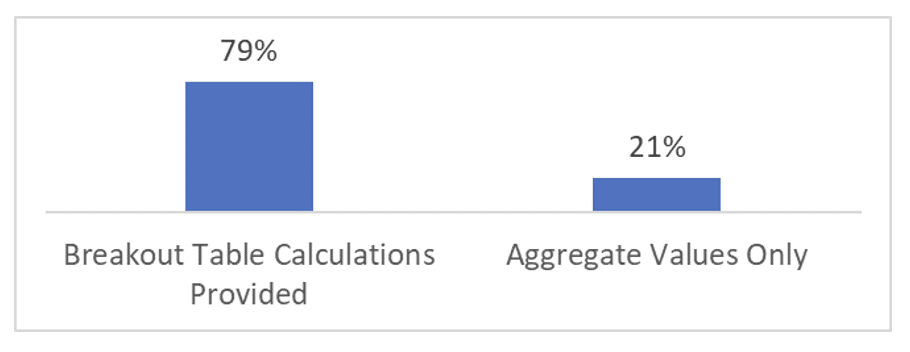
Figure 12: Granular Equity Adjustment Calculations
This will be an obvious area for SEC comment letters should the SEC decide to focus on disclosures that are missing required elements.
One interesting observation is how many companies provide a partial breakout table but omit the row pertaining to dividends paid. We only counted dividend-paying companies that issue dividend equivalent units or accrued cash dividends on their equity awards. While it’s possible these companies incorporated dividends into a different breakout table row, it’s also possible that dividends were erroneously omitted altogether from the determination of CAP.
The SEC’s guidance is ambiguous about valuation assumption disclosure. Item 402(v)(4) instructs companies to disclose in a footnote “any assumption made in the valuation that differs materially from those disclosed as of the grant date of such equity awards.” Most companies elect not to provide any such disclosures (Figure 13).
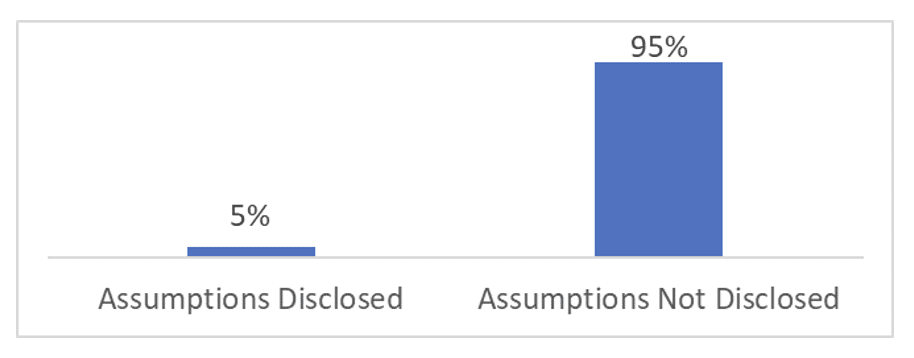
Figure 13: Assumption Disclosure Prevalence
The guidance quoted above is from the final rule incorporated into Item 402 of Regulation S-K. All 233 pages of the SEC’s release are in the federal register, but the rule itself that is incorporated into Item 402 is of course much shorter. To this end, when you read all 233 pages, there’s quite a bit of commentary suggesting that disclosure of the valuation assumptions may be appropriate to disclose more often (e.g., pages 64, 144, 147, and 155).
For example, two assumptions that are bound to differ from those at the date of grant are the stock price itself and the interest rate. Interest rates have obviously changed a lot since most of the awards being valued were initially granted. Expected term estimates on options also won’t be the same due to the passage of time and moneyness of the awards being valued.
Even so, there’s no bright line. Even though interest rates have undoubtedly changed between the date of grant and the point of revaluation, the effect on total value is usually small. Perhaps the expected term assumption has changed, but the methodology for calculating it has not.
While we tend to lean toward over-disclosure, our advice is to document (internally) a point of view to create contemporaneous evidence in support of the approach you take. If you define materiality in the context of an overall effect on value, run some comparison analytics to assess how sensitive the final values are to the actual assumptions.
Two particularly well-done disclosures that include valuation assumptions are MBIA and Raytheon Technologies.
We’ll end with the top five areas of risk we noticed during data collection.
We’re amazed by the collective mobilization corporate legal, HR, and finance departments have shown in executing under such unprecedented timelines. There are bound to be quality and stylistic differentials in the disclosures, giving rise to important planning and reflection as we shift our sights to next year’s proxy season.
The question many companies are asking is whether PvP will go the way of CEO pay ratio and become purely a compliance exercise. We have mixed feelings. CEO pay ratio simply doesn’t convey very much information whereas PvP provides a wealth of new data that never existed in a standardized capacity. It’s complex—maybe too complex—which creates apples-to-oranges comparison problems, but it’s rich in content.
Proxy advisors and institutional investors are bound to look for ways to productize a PvP grading framework that allows them to consider PvP results in their voting recommendations and decisions. We’re skeptical as to whether anything of this nature will be applicable in year two. The media is also trying to sort out how to write about PvP outcomes.
More importantly, and regardless of how PvP does or does not get weaponized by the media and folded into proxy advisor grading frameworks, compensation committees and management will have questions. The classic question in finance is “what changed and why?” This is a natural question when eying a PvP table that contains large surges in CAP that may occur at a larger or smaller rate than TSR. As we think about how to serve clients in year two, we are extremely focused on producing new analytics that clearly and visually explain movements in CAP.
We invite you to reach out should you have any questions or comments about the contents discussed here.
Download This Blog Post
Insights From Company Pay vs. Performance Disclosures
