Subscribe to Our Newsletter
Hear more from Equity Methods: Your trusted partner in equity compensation excellence.
This June, we hosted a webcast covering the regulatory and shareholder forces impacting compensation. With so many in attendance, we thought it would be a good opportunity to see what people thought about the issues. We polled the 227 attendees on six rather diverse topics:
The first webcast topic was about the effects of the Tax Cuts and Jobs Act—that is, tax reform—on executive compensation.
We asked attendees if they planned on changing their performance metrics or goals as a result of tax reform. Was anyone, for instance, going to hike their net income goal by the amount they expected tax reform to boost earnings? Were there any plans to do away with an after-tax metric like EPS because of uncertainty around tax reform’s long-run effects?
The big conclusion is that tax reform’s full effects and impact on compensation are largely unresolved. Most companies (58%) haven’t yet decided whether to make any changes. Of the ones that have formally decided, Figure 1 shows that most elected not to make adjustments.
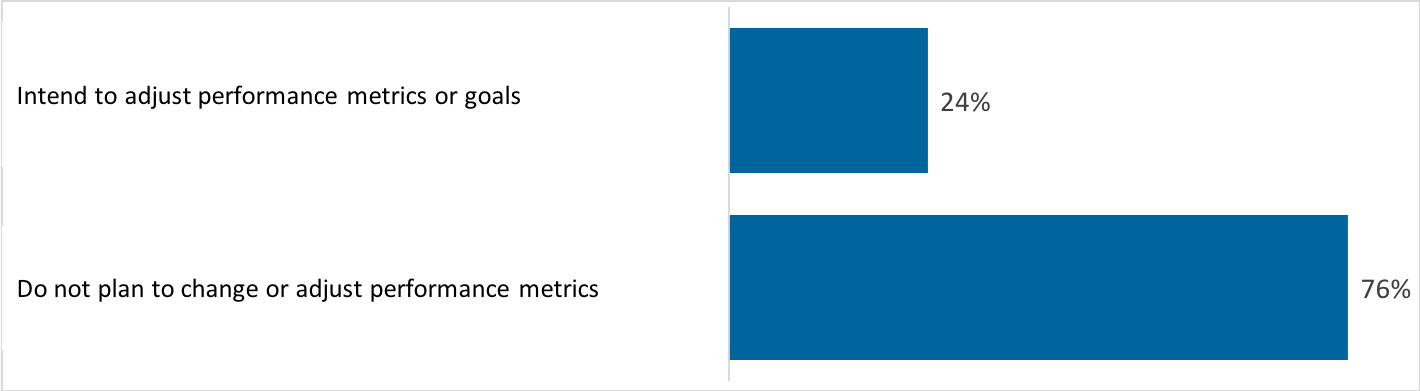
Figure 1: Do you intend to adjust performance metrics as a result of tax reform? [excludes respondents without after-tax metrics since this subgroup is less affected by tax reform]
Although tax reform stands to potentially reshape many companies’ financials, the specifics are largely unknown. For example, we’ve spoken with CFOs who are evaluating moving their offshore R&D activities back to the US from Ireland or Eastern Europe. They estimate that this could have a double-digit impact on earnings. Senior management and the compensation committee know they need to take structural changes like this into account when setting performance goals, but they don’t yet have enough clarity on how.
The decision to change metrics or goals is itself complicated, which is why most companies remain unresolved on what they will do. Changing your metrics means transitioning from an after-tax metric like EPS to one that’s less affected by tax reform, such as pre-tax earnings or total shareholder return (TSR). This is a consequential decision, and while it allows you to largely sidestep the uncertainty linked to tax reform, that might not be an adequate reason to alter your executive incentives. Changing goals means raising or lowering threshold, target, and stretch levels to factor in the positive or negative effects of tax reform. In concept that sounds nice, but remember that most companies don’t yet know what that specific adjustment factor should be.
As a result, we expect to see many companies making adjustments at the time of payout to factor in curveballs presented by tax reform. If you’re in this situation, be careful to avoid triggering modification accounting.
What about those who don’t use after-tax metrics? This question doesn’t apply to them, so we excluded their responses. Still, it’s worth noting that group is quite large (30% of the full population). Relative metrics are arguably the ones that tax reform directly impacts the least, since they’re supposed to filter out macroeconomic noise that individual firms can’t avoid.
Generally, we expect to see greater use of relative metrics in the years ahead. There’s a governance push for three-year performance periods over one-year periods, and absolute metrics are very tough to set over a three-year period. Additionally, equity prices are at all-time highs. It’s prudent to plan and design grants with future market volatility in mind, which of course makes goal-setting more complicated.
The other prediction we have is that non-GAAP metrics will become even more prominent. From our surveying, we’ve found that while nearly all companies adjust for accounting standard changes, most other kinds of adjustments (such as for M&A, currency fluctuations, or divestitures) do not have majority prevalence.
However, given how controversial non-GAAP adjustments can be, we don’t expect to see a universal uptick in their use. Instead, we think most will use them in a targeted and more selective way. We also expect companies will more carefully document exactly how they carry out their adjustments, just to avoid any concern about cherry-picking the results.
The next question we asked was how the elimination of the 162(m) performance-based exclusion would change metric selection in long-term incentive (LTI) plans. Earlier this year, there was some speculation that if performance features stopped being tax-deductible, companies might eliminate those features in lieu of greater discretion or pure time vesting.
That prediction never materialized. Only a small number of respondents said they plan to change their long-term incentive plans due to losing the 162(m) deductibility.
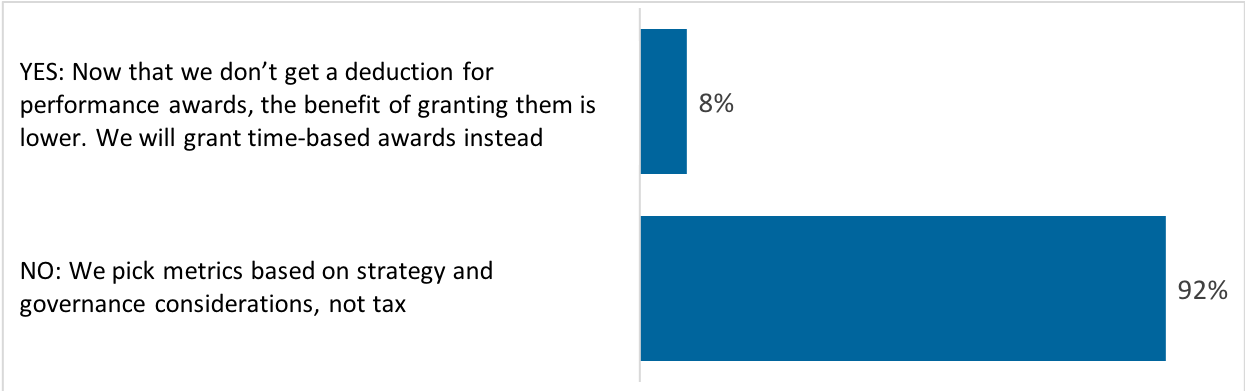
Figure 2: Do you plan to make any changes in your performance-based award granting practice in light of the 162(m) change?
This matches our anecdotal discussions with clients. Remember, 162(m) only applies to top executive officers. The equity granted to everyone else, whether it’s time-based or performance-based, is deductible. Boards make executive pay decisions based on governance and incentive goals. After—and only after—those priorities are satisfied do tax considerations influence strategy.
Our question was about long-term incentive plans, where it’s virtually unheard of to remove performance provisions or use overly subjective goals. We do, however, think companies will become more open to changing the annual bonus plan. As part of this, they could consider adding discretion so that the CEO or compensation committee has the ability to adjust the calculated results based on more subjective assessments of performance. The problem with adding subjective terms to the long-term plan is that doing so would trigger variable accounting, but that’s not a concern on the annual plan.
In short, the use of performance provisions in long-term equity plans is probably here to stay. However, subjective performance metrics now have one less strike against them. So if adding subjectivity to a metric serves a strategic human resources goal, and firms can handle the variable accounting and governance pushback, there’s now one more reason to do it.
Next, we turned to Accounting Standards Update 2016-09 (ASU 2016-09). More specifically, we zeroed in on the decision to relax the trigger for liability accounting related to tax withholding.
Prior to ASU 2016-09, any withholding above the minimum statutory level caused the award to be classified as a liability. Now, liability classification is triggered only if withholding occurs above the maximum statutory level.
This revision had near-unanimous support among practitioners, because withholding at the minimum statutory level created friction for executives who then needed to make estimated tax payments to avoid an under-withholding problem. Unfortunately, what seemed like an obvious solution—giving executives the choice to withhold up to the maximum statutory rate—wasn’t really up for consideration.
That’s because IRS guidance prescribes only two ways to set withholding rates. One is the flat rate method, which involves withholding at 22% on supplemental income until $1 million of income is earned. At that point withholding flips to 37%. The second is the W-4 method, which involves participants submitting a new W-4 with a specified withholding dollar amount.
The flat rate method doesn’t solve the problem of under-withholding and the W-4 method is administratively complicated to pull off. As a result, we’ve heard anecdotally that many companies haven’t changed their withholding policies despite ASU 2016-09 paving the way to do so. Therefore, we were eager to see if market trends had changed. The answer, mostly, is no.
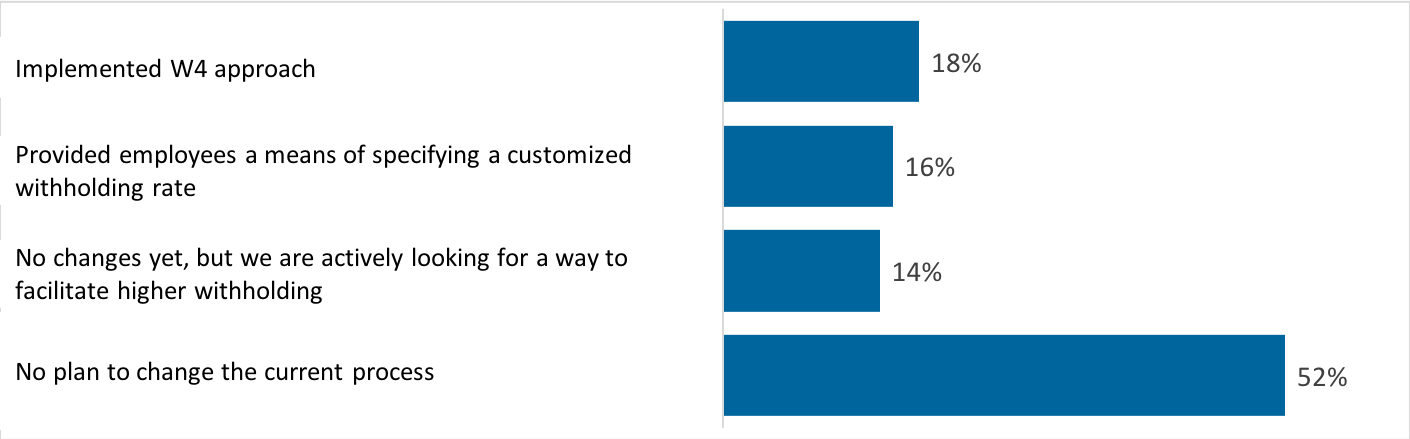
Figure 3: What, if anything, have you changed in your tax withholding approach?
We put this same question before a similar audience almost exactly two years ago. Sentiment has nudged—but only nudged—toward implementing the W-4 approach or delivering full customization to participants.
The reason changes have been so subdued is concern over the IRS’ published guidance offering only two means of withholding, neither of which conveys very much flexibility to plan participants. As for the W-4 approach, it appeals mostly to very small organizations where the payroll manager and compensation manager sit close together—or are one and the same person.
This is an area where we think additional IRS guidance could be useful, and we suggest that you consider writing the IRS if your organization is constrained by the two permitted withholding approaches. Since the desired approach would basically result in more money being withheld, we believe that conceptually it’s something the IRS may find palatable if enough parties express an interest.
When ASU 2016-09 came out, perhaps the most controversial piece was the decision to eliminate the APIC pool and run excess tax benefits and shortfalls through the P&L. Companies feared both earnings and effective tax rate volatility. Since 2016, however, equity prices have done well and most companies have (at least on paper) benefited from the APIC pool elimination.
A more contemporary issue we’ve been investigating is the intersection between this component of ASU 2016-09 and the trend toward using non-GAAP performance metrics in LTI design. (In other words, we honed in on how performance metrics are drafted, and not the parallel question of what is included in non-GAAP earnings reported to the street.) One of the most common non-GAAP adjustments is to exclude stock compensation expense from whatever earnings measure is in use. For instance, a company with a rising stock price might exclude the expense but include the tax benefit.
In our survey, however, no respondents say they do that—which is reassuring given that this would boil down to window-dressing. In fact, the largest group of respondents (45%) have decided to include both the tax benefit and upfront stock compensation expense in their non-GAAP earnings.
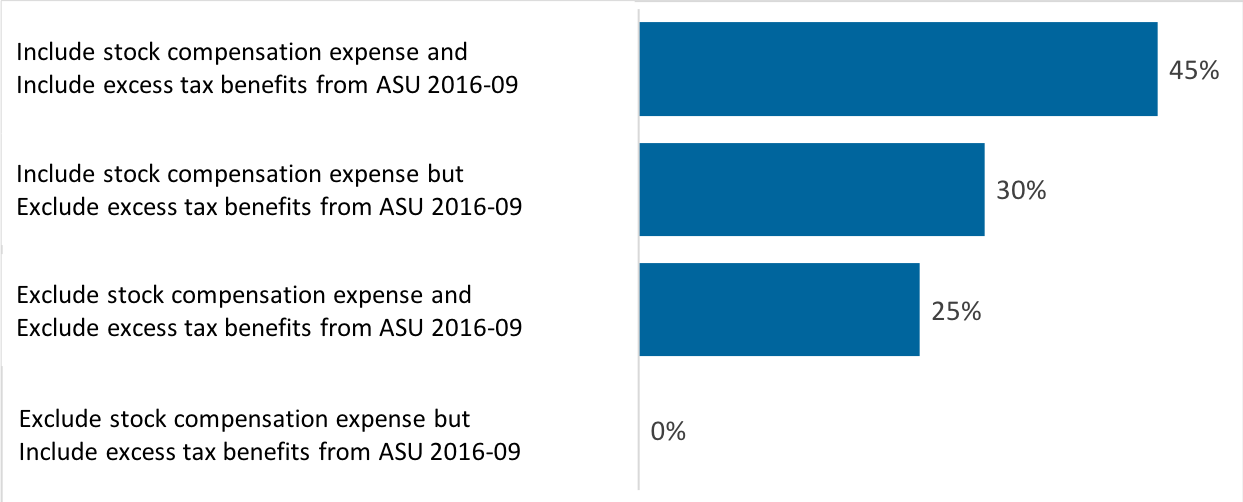
Figure 4: In your LTI performance metrics, how do you treat stock compensation expense and the related excess benefits stemming from ASU 2016-09?
Some 30% say they include stock compensation expense but exclude the excess tax benefit. This could simply be due to their using a before-tax performance metric, or to specific concerns about ASU 2016-09. Either way, this seems more reasonable than the inverse.
Remember, this survey question is about how LTI performance metrics are established. The sister question (not asked) is how trends are evolving with regard to including or excluding stock compensation expense and excess tax benefits in non-GAAP earnings. We hope to survey on this related question at some point in the near future, so stay tuned.
Pay equity is a rapidly-emerging topic. Although regulatory forces are driving it to some extent, the predominant forces are shareholder concerns and the acknowledgment that getting this right will unlock additional human capital strengths and opportunities. We asked attendees two questions to begin unpacking this intricate topic.
First was what organizations are doing about pay equity so far. The results are mixed and show that organizations are at rather different places on the continuum.
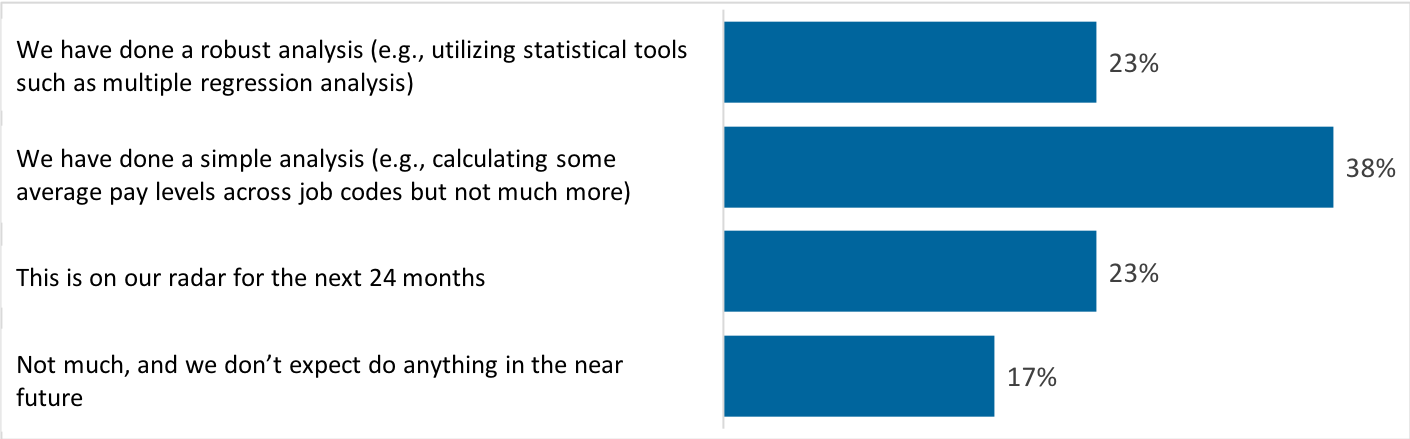
Figure 5: What have you done with regard to pay equity?
To be sure, the question wasn’t whether there were pay equity problems, but rather whether there were organizational processes to test for the presence of problems—both at a particular moment and over time. At the most advanced level, processes go beyond analyzing pay to establishing a broader framework that supports recruiting and advancement. That’s because problems, where they do exist, are often more complicated than pay inequities.
Survey results reveal that the amount of investment in pay equity measurement processes closely correlates with firm size. Fortune 500 firms, on average, have been able to invest more in getting these processes up and running. Our prediction is that this topic will hit the radars of most publicly traded companies in the next five years.
Therefore, if you’ve never done a pay equity analysis, we suggest getting ready to do so sooner rather than later. Best practice is to use multiple regression and other statistical techniques in order to more accurately untangle the many factors influencing pay. The premise of a pay equity study is to separate the healthy factors driving pay levels (e.g., job level, performance, or tenure) from the unhealthy ones (e.g., gender or race).
We actually find that most organizations don’t have widespread problems. The issue is usually more nuanced. It might not even be pay-related, but rather a pipeline situation where people of one class seem to turn over more frequently at a particular level of seniority. Regression analysis is particularly useful for cutting the data in multiple ways to see what’s taking place beneath the surface.
If your organization has operations in the UK, mandatory gender pay reporting has already begun. While the UK rules are highly prescriptive and simplistic, they do put pay equity information in the hands of committee members and the general public. This makes it all the more important to structure a study based on the variables that matter. That way, you can explain pay via an objective understanding of what’s happening in the data.
A central question of a pay equity analysis is what to do with the results. Before discussing this, it’s important to note that these studies are generally best done under legal privilege so that the results are not discoverable in the event there is litigation. Not every organization takes this route, but in our experience the majority do.
Many options exist after conducting a pay equity analysis. First, the results may indicate there is no pay equity problem. In that case, the next steps are to ensure ongoing monitoring, preventative education and training, and analysis to see if there are related human capital problems. For example, it’s not uncommon to see few women or minorities in leadership positions. If that’s the case, drill into the data to see whether the problem originates at the beginning of the pipe (relatively fewer enter in lower-level positions) or mid-pipe (higher attrition levels some number of years in). This can inform investments in anything from recruiting to leadership development to helping people reenter the workforce if they’ve taken some time off.
However, suppose the pay equity analysis reveals that there might be a problem. (We stress the word “might” because even advanced and sophisticated statistics are, at the end of the day, drawing inferences from noisy and imperfect data.) There are three remediation approaches that companies can take, which we asked about in our survey. Of the three, only 8% say they’ve gone public with a pay equity remediation process.
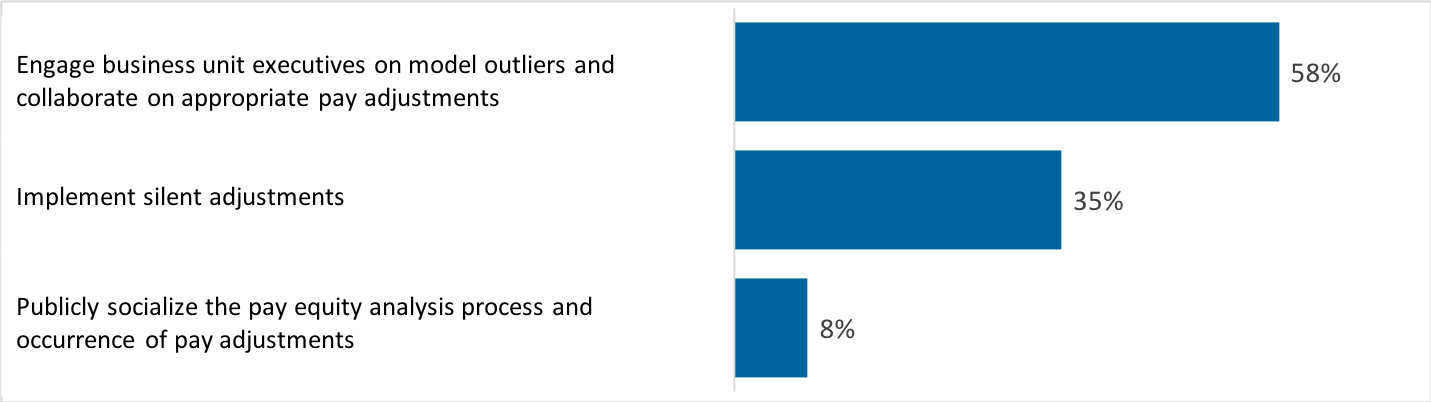
Figure 6: If applicable, what approach toward pay equity remediation have you taken (or would expect to take)?
This is a complicated issue. The best example of a public socialization process is Salesforce.com, in which CEO Marc Benioff appeared on 60 Minutes to explain the company’s approach and what they did with their results.
At the other extreme, some companies make silent adjustments. A silent adjustment involves taking the proposed fix from a statistical model, weaving it into the annual merit process, and not explaining to anyone the rationale for the adjustment.
The middle-of-the-road approach (and the one we’re partial to) involves taking the outlier results of a pay equity analysis into discussions with business line executives. As a basic case study, consider a large retailer with four core lines of business. The CHRO takes the results to the four business executives to find out what they mean. The four executives are expected to keep the matter discreet, but to find out whether there were other factors behind the prevailing pay levels that the model might not have picked up.
The benefit of this approach is twofold. First, models are only as good as the data going into them, and there’s no such thing as perfect data. Second, these conversations have a major positive externality of creating a tone from the top that pay equity matters. When the CHRO, operating under the request of the CEO, engages business unit managers in concrete discussions of pay equity, it sends an important signal of what’s valued. It also provides a nice segue into anti-bias training and other prevention initiatives.
We’ve seen all three remediation approaches work. As noted, our preference is toward the pragmatic middle-ground model, but more generally this is an important item to monitor as best practices continue unfolding.
To summarize our webcast, external factors continue to affect equity and executive compensation. This year has been an especially active one thanks to an extraordinary confluence of regulation, shareholder activism, and tax reform. For more information about this survey and the results, please contact me.
