Subscribe to Our Newsletter
Hear more from Equity Methods: Your trusted partner in equity compensation excellence.
The use of non-GAAP measures has been a controversial topic for decades and the subject of ongoing SEC rulemaking.[1]
Non-GAAP earnings metrics intersect with stock-based compensation (SBC) from two angles. One is that SBC expense is one of the most popular exclusions to make in formulating a non-GAAP earnings metric. The other angle is that SBC awards often contain performance goals that are based on non-GAAP metrics.[2]
These are separate yet connected issues. The exclusion of SBC expense from a non-GAAP earnings metric is an investor-oriented decision that implicitly asserts SBC expense is not a useful measure of core earnings. The use of non-GAAP earnings metrics in executive compensation awards reflects an effort to link pay to performance, and specifically, measures that reflect core operating effectiveness.
Welcome to part 1 of a series on non-GAAP metrics and their intersection with stock-based compensation. In this article, we look at the treatment of stock-based compensation in non-GAAP earnings exhibits that are presented to investors (“the Street”). In the next article, we’ll look at how non-GAAP metrics are used in executive compensation. Future installments may unpack SEC regulation on non-GAAP metrics and present additional statistics.
About the Research
This series is based on a sample of 200 companies from a hand-collected database. Companies were selected randomly but with a constraint to ensure representation across all 12 economic sectors. Data on non-GAAP street earnings metrics is from each company’s most recent earnings release (late 2021 or early 2022). Data on how non-GAAP earnings are used in executive compensation arrangements is from each company’s most recent proxy (usually 2021).
**************
Before honing in on SBC expense as a non-GAAP street earnings metric, let’s start by looking at the overall categories of non-GAAP exclusions available.
The core principle in selecting non-GAAP street metrics has to do with asset valuation. The objective is to measure core earnings that are expected to endure and can be trended into the future in discounted cash flow models. The theory is that non-GAAP metrics help investors arrive at better models for asset valuation purposes. Textbook examples of common exclusions include restructuring charges, non-core gains and losses, and goodwill impairment.
The debate in investor circles is whether too much is being excluded. After all, why not let investors choose what goes into their valuation models? For instance, many companies experience serial litigation that could be hard to characterize as non-core or non-recurring. This is one reason the SEC has issued so much guidance on the proper use of non-GAAP metrics, such as requiring that they not be given greater prominence than their GAAP counterparts.
In our sample, over 87% of companies include at least one non-GAAP metric in their earnings releases. Taking a brief look at the panel of common exclusions, we’re not surprised to see SBC expense at the top of the list.
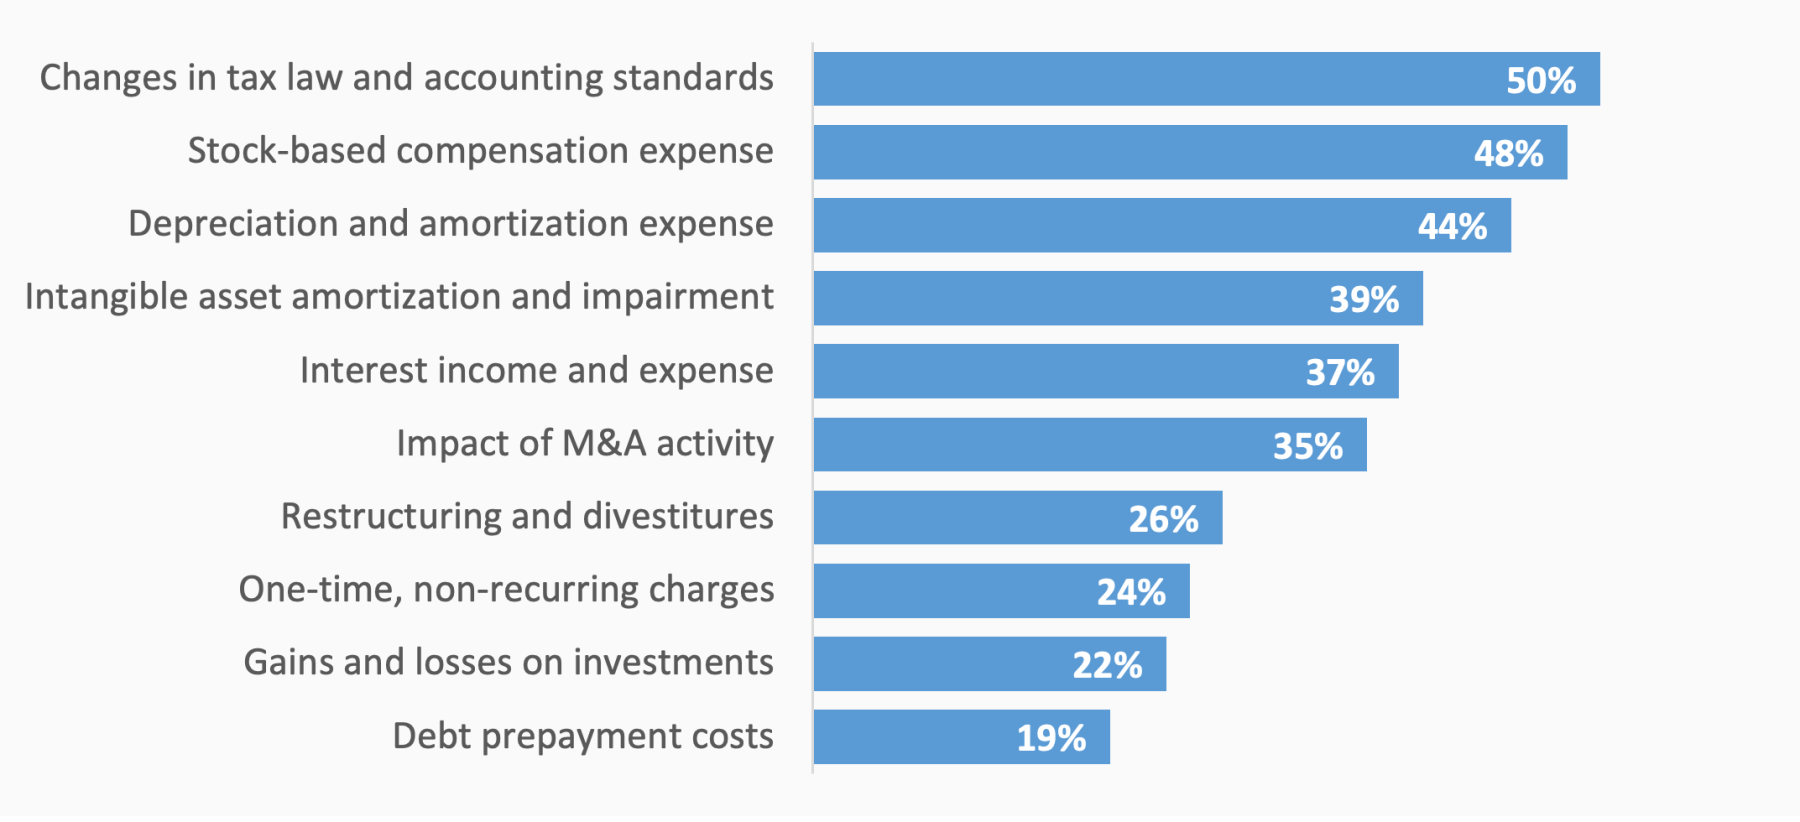
Figure 1: Most Common Non-GAAP Exclusions
The five least common exclusions are:
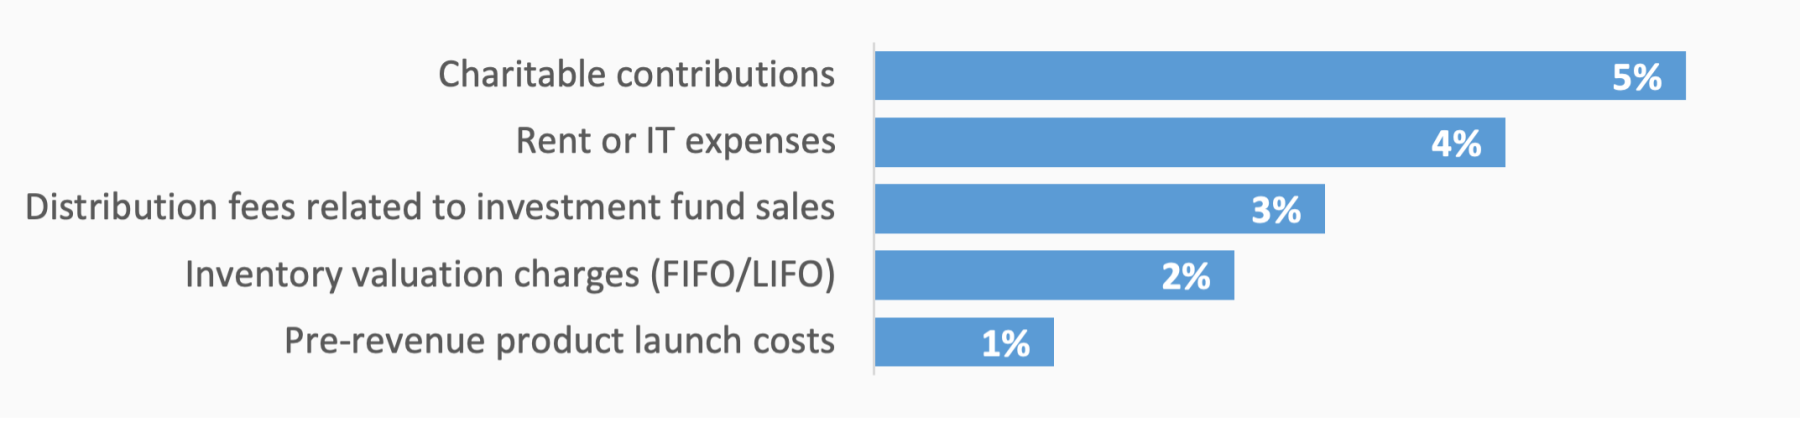
Figure 2: Least Common Non-GAAP Exclusions
Organizational maturity, measured in the number of years post-IPO, is a primary variable in the number of non-GAAP exclusions used.
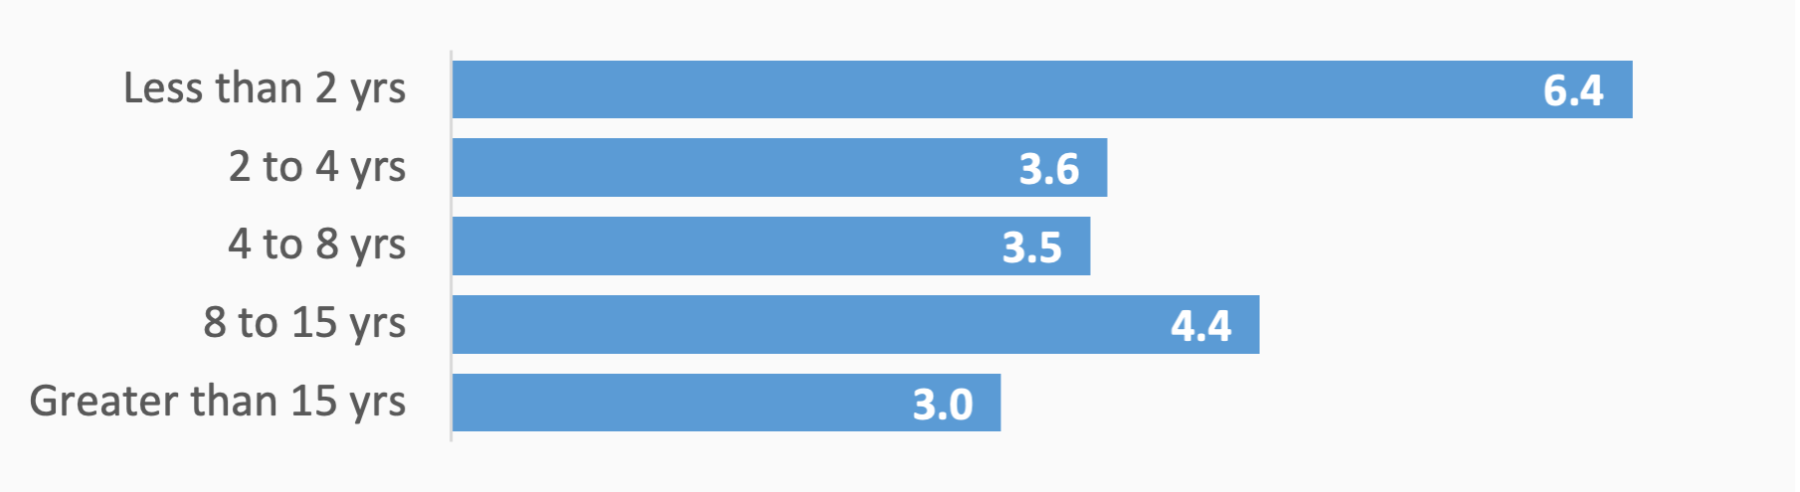
Figure 3: Average Number of Non-GAAP Exclusions by Years since IPO
When going public, companies generally begin with a more liberal set of exclusions, then quickly shed ones that are excessive. After that, the averages begin trending back upward. As companies mature, they tend to have more complex operations, such as operating in a greater number of markets or pursuing an acquisition strategy. This gives rise to more complex financials and greater motivation to broaden their non-GAAP exclusions.
For the most part, the number of non-GAAP metrics used is not particularly sensitive to revenue or market capitalization levels. It is, however, quite sensitive to sector:
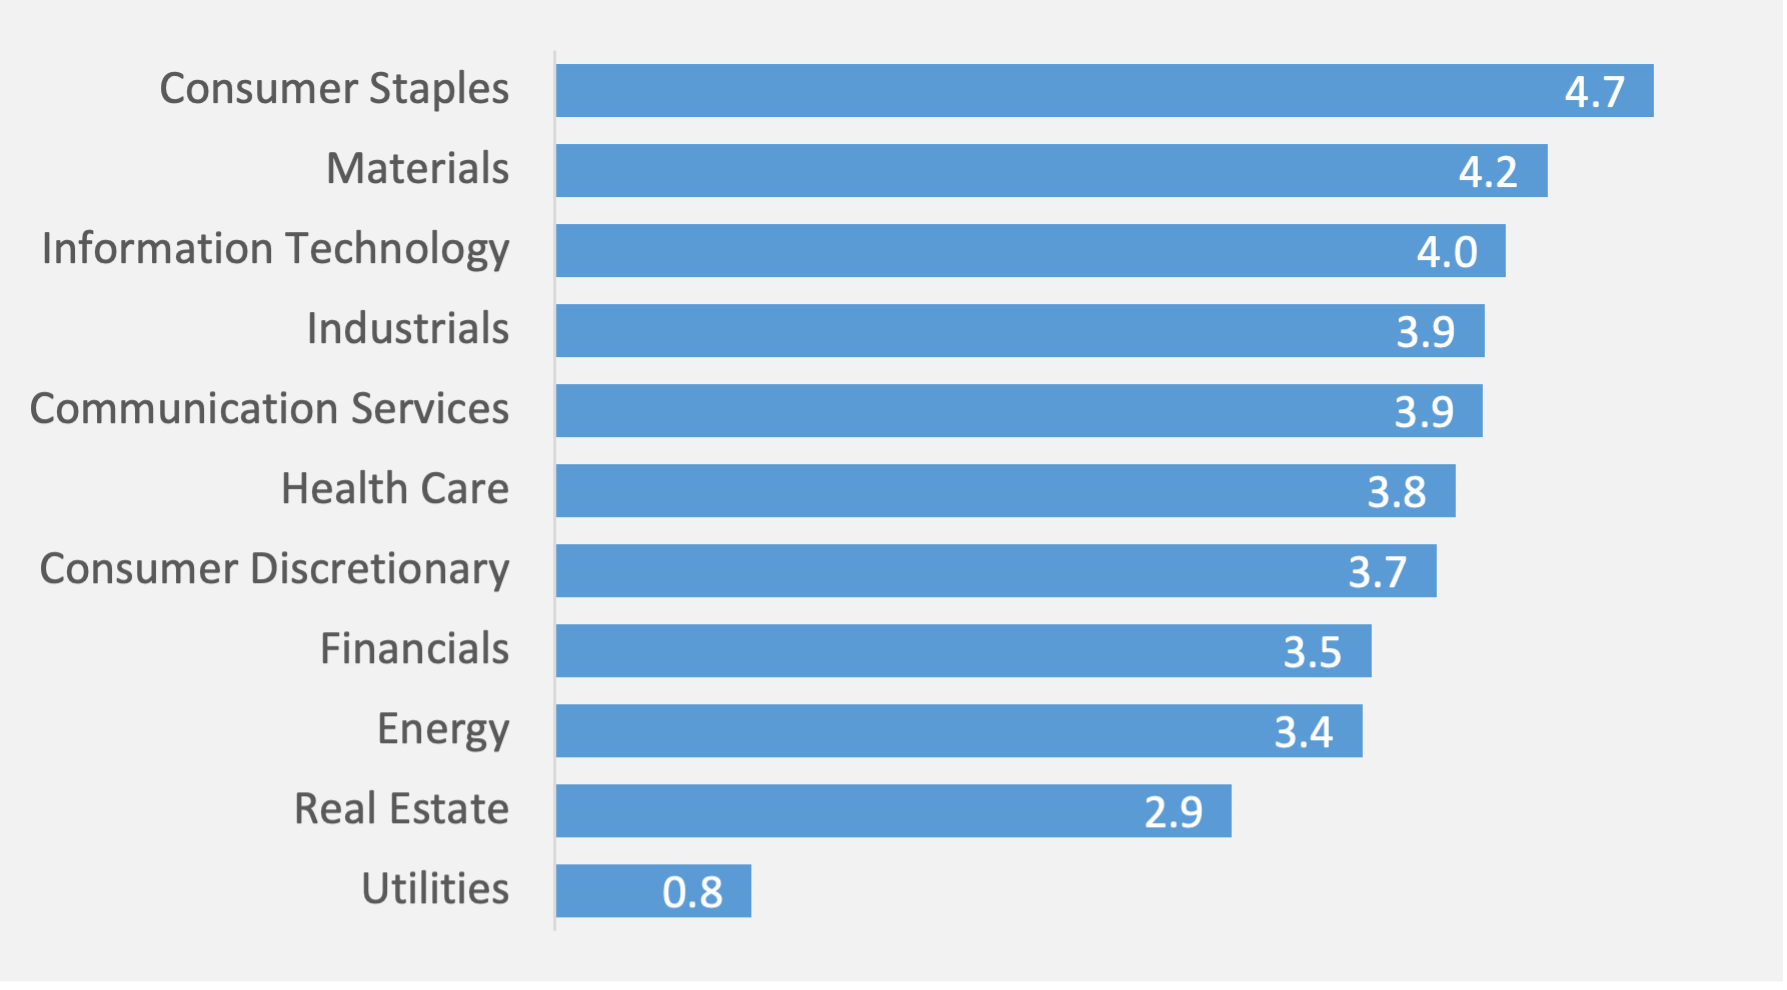
Figure 4: Average Number of Metric Exclusions in Non-GAAP Earnings by Sector
It might be surprising to see technology rank low in the list. Don’t be misled, though. There’s a big difference between the number of exclusions and the magnitude of those exclusions. Technology firms tend to have fewer excludable expenses, but the ones they do exclude (e.g., stock-based compensation) tend to be large. Financial firms, on the other hand, have particularly complex financials, which is correlated with the number of adjustments adopted.
Now let’s examine the question finance executives are asking: Should we exclude stock-based compensation from non-GAAP street earnings?
Stock compensation has been one of the most controversial exclusions to non-GAAP earnings. Some say SBC values should be excluded because the highly technical and probabilistic models involved in calculating SBC expense obscure measures of core performance and profitability. Others counter that SBC is a recurring and vital form of employee compensation that, if eliminated, would require an offsetting increase to cash compensation. Beyond that, including SBC expense in presentations of non-GAAP earnings can boost investor confidence in the quality and sustainability of earnings. It signals that the company is maturing.
Newly public companies almost universally exclude SBC in their non-GAAP presentations of earnings. The tough question is when (if ever) it becomes time to change course. Our data suggests there’s a precipitous drop-off in the number of companies excluding SBC expense even a few years post-IPO, with the prevalence dropping from over 90% to roughly 50%. The prevalence plateaus at 50% for quite some time until companies reach a much higher level of maturity, at which point fewer than a fourth of companies exclude SBC expense.
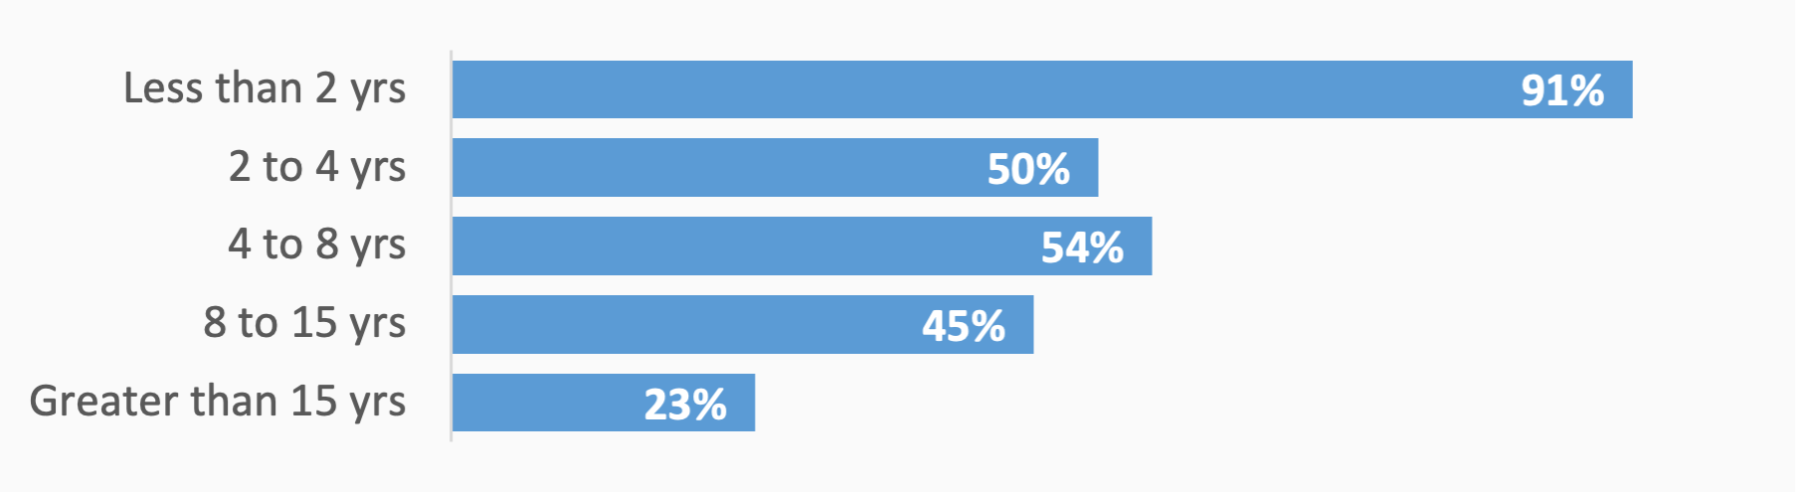
Figure 5: SBC Exclusion Prevalence by Years Post-IPO
Another murky area is whether it matters if a company reverses policy and includes SBC expense in presentations of non-GAAP earnings, like Alphabet did.
**************
Alphabet Changes Course
Alphabet made headlines in 2016 when it remarked in its Q4 earnings call that it would no longer exclude SBC expense in its presentation of non-GAAP earnings. Alphabet’s CFO explained:
First, we are making changes to our non-GAAP reporting. SBC has always been an important part of how we reward our employees in a way that aligns their interests with those of all shareholders. Although it’s not a cash expense, we consider it to be a real cost of running our business because SBC is critical to our ability to attract and retain the best talent in the world. Starting with our first quarter results for 2017, we will no longer regularly exclude stock-based compensation expense from non-GAAP results.
**************
In some respects, non-GAAP exclusions are about picking battles, which means some industries will exhibit greater tendencies toward specific exclusions.
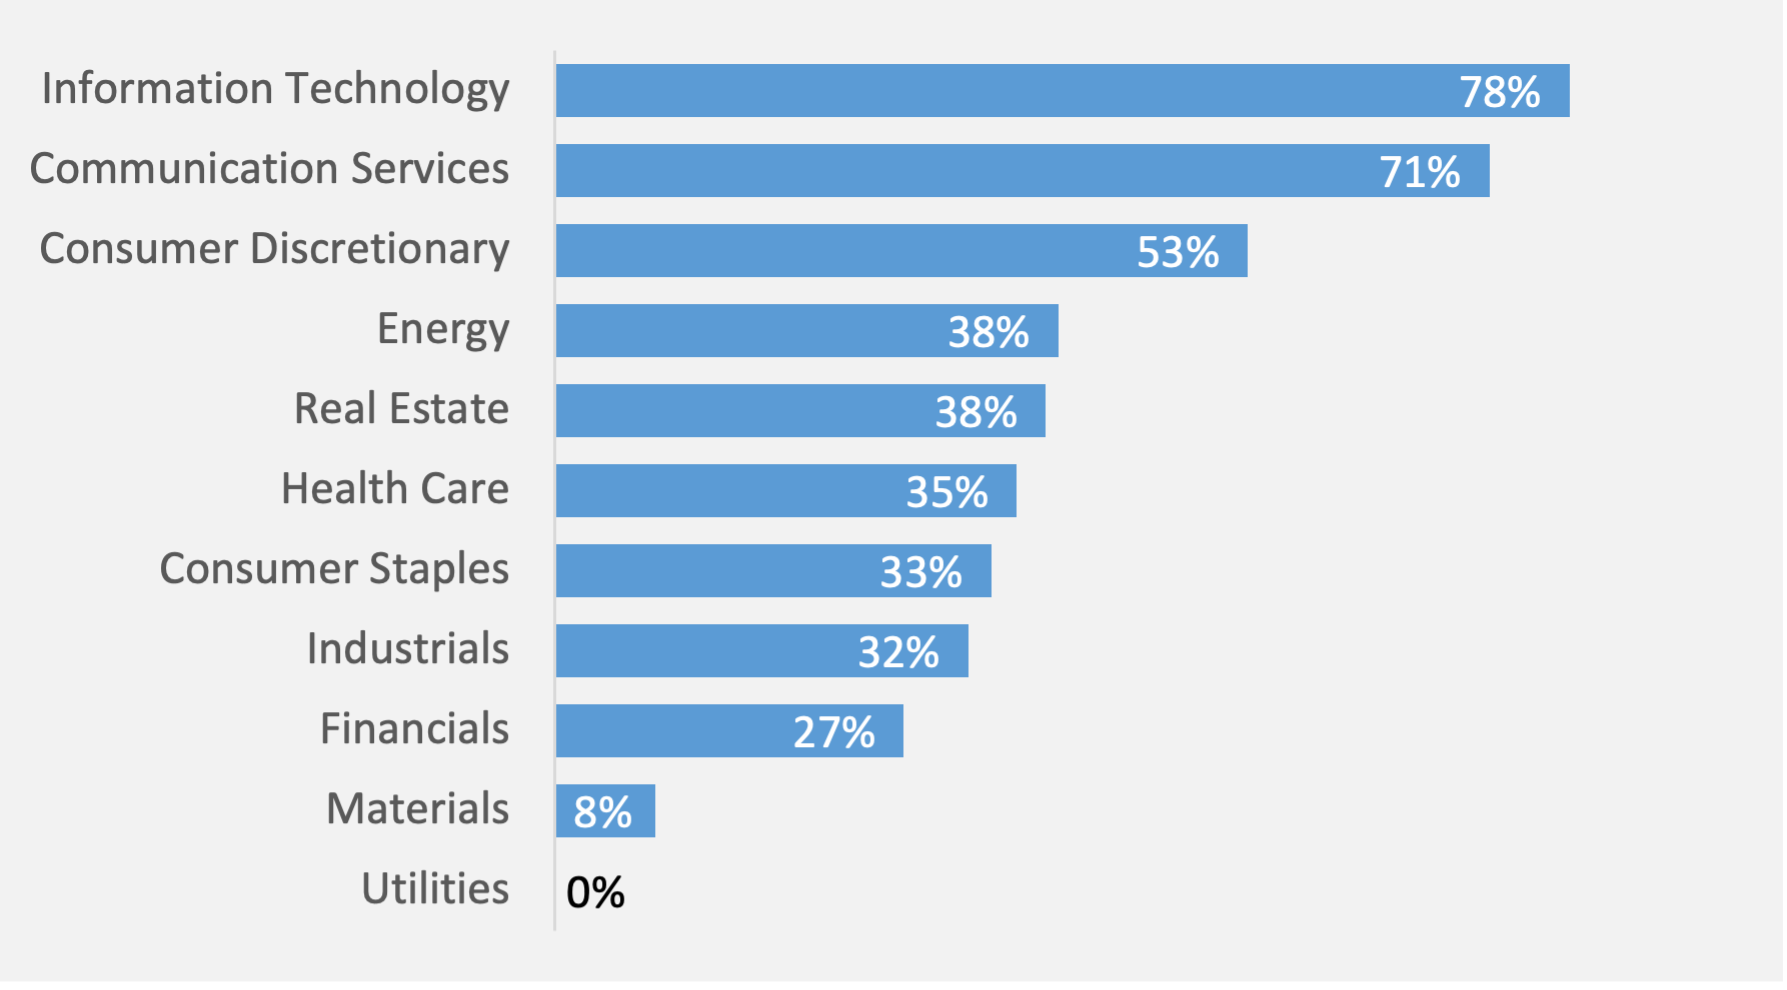
Figure 6: SBC Exclusion Prevalence by Industry
It’s hardly surprising to see technology at the top of the list given the storied history the industry has with equity compensation accounting. But what is surprising is seeing a sector like health care ranking relatively low while industrials are near the top.
If we sub-segment our sample to look at technology companies, we see a relatively consistent pattern of excluding SBC expense until they reach a high level of organizational maturity. But even then, almost half continue to exclude SBC expense.
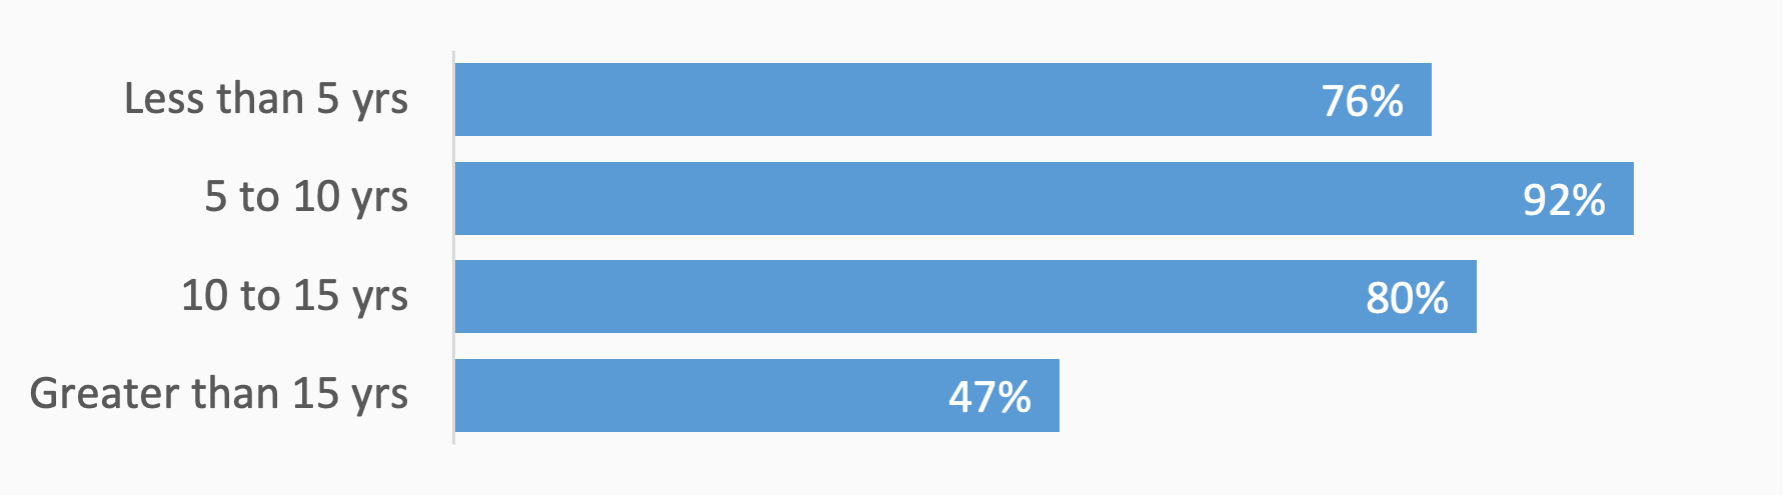
Figure 7: SBC Exclusion Prevalence by Years Post IPO within the Technology Sector
This begs the question: Does the market explicitly reward (immediately or over time) the positive signal that comes from including SBC expense in measures of non-GAAP earnings? Are mature companies who do not transition away from excluding SBC expense penalized or treated differently? Event study frameworks can provide some answers, although the sheer number of factors impacting security prices makes quantitative measurement difficult. (This is a potential research topic for a future installment in the series.)
Last, we looked at how the decision to exclude SBC expense varies by size, which we proxy for using market capitalization and revenue.
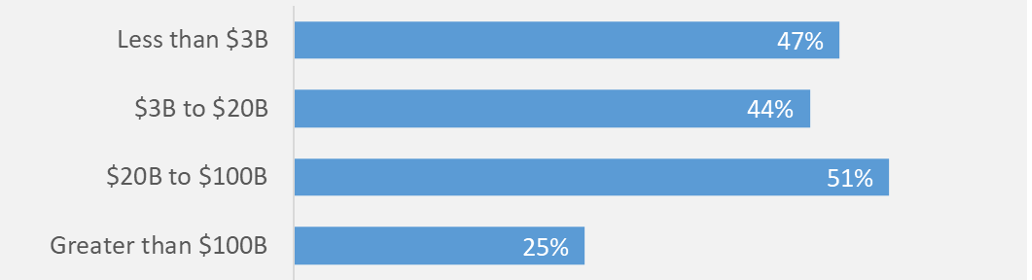
Figure 8: SBC Exclusion Prevalence by Market Cap Quartile
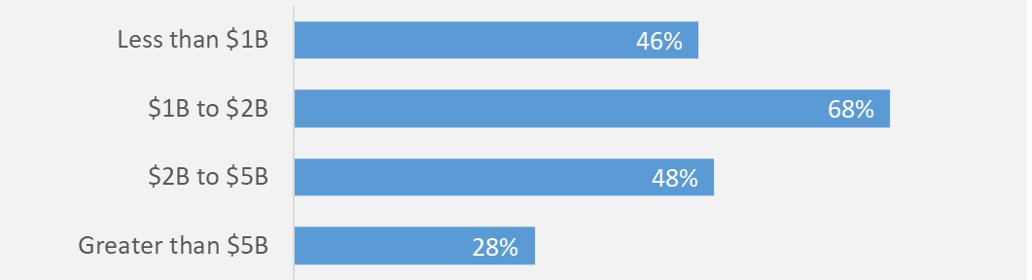
Figure 9: SBC Exclusion Prevalence by Revenue Quartile
Overall, we see general similarity in results wherein only the largest quartile of companies exhibits a lower exclusion prevalence. One implication this analysis has is that for companies outside the technology sector, there’s a much greater risk of becoming an outlier by waiting too long to rethink the decision to exclude SBC expense in formulations of non-GAAP earnings.
Non-GAAP metrics are a complex topic, in both the presentation of earnings to the Street and the structuring of executive compensation awards. Each has similar, but different, priorities and risks.
In this first installment of our multi-part series, we looked at how SBC expense is used as a specific non-GAAP exclusion. While much has been written about non-GAAP metrics and SBC has received periodic attention as a specifically controversial exclusion, to the best of our knowledge, this is the first deep empirical focus into the patterns underlying SBC exclusion decisions.
Our data shows considerable diversity in practice. While that suggests flexibility to follow your own path, shareholder and regulatory scrutiny of non-GAAP measures has never been higher. SEC comment letters are frequent and enforcement action isn’t unheard of in the wake of so much regulation on the topic. Fortunately, the SEC’s C&DIs and comment letter context provide guidance that most companies can effectively navigate. That leaves shareholder risk.
SBC expense continues to be a popular exclusion in non-GAAP street earnings. But it’s controversial among shareholders, leading many high-profile companies to discontinue the practice. Our advice is to make sure that SBC expense doesn’t overstay its welcome as a non-GAAP exclusion. Watch what your peers do and be intentional in deciding whether to move early, late, or sometime in between.
In the next installment, we’ll turn the tables and look at all the exclusions used in establishing non-GAAP performance metrics for executive compensation awards (SBC expense being just one). Please don’t hesitate to reach out if we can be helpful in evaluating any of the topics discussed here.
[1] In addition to periodic enforcement action, the SEC’s Compliance and Disclosure Interpretations guide much of how companies approach the disclosure of non-GAAP earnings metrics.
[2] SBC awards refers to long-term incentive awards, which generally vest over multiple years and link pay to one or more performance metrics. Short-term incentive awards are usually paid in cash and cover performance over a single fiscal year. These also may be based on non-GAAP metrics. In this paper, we focus our research on long-term incentive awards, but the concepts generally apply to short-term incentives as well.
