Subscribe to Our Newsletter
Hear more from Equity Methods: Your trusted partner in equity compensation excellence.
Pay equity refers to making sure there are not any inexplicable pay gaps between people of different diversity categories—mainly gender, race, and ethnicity. Of the three, gender pay equity generates the most discussion. More broadly, however, it’s an increasingly important issue in compensation and corporate governance circles. Unlike the impending CEO pay ratio rule, which is driven by SEC regulation, questions about pay equity are coming from shareholders and compensation committees.
Here’s a primer on what you need to consider as you get ahead of this issue.
More than ever, companies are fielding questions about environmental, social, and governance (ESG) topics. In fact, a growing number of asset management firms build their strategies on socially responsible investing. Trillium and Zevin Asset Management are two of many examples.
So far, shareholders have approached over 30 publicly-traded firms with proxy proposals to study pay gaps across various demographics. Some of those firms have agreed to the study, thereby removing the proposal from the proxy. But many other examples of such proxy proposals remain—TJX Companies being one:
We expect to see a climbing number of these proposals. While technology and retail are recent targets, the issue should be independent of industry.
Shareholders aren’t the only driving force behind pay equity questions. Compensation committees are helping to make this a much bigger priority. One cause? The growing spotlight on board gender diversity. However, some compensation committees are asking questions to make sure there are no hidden problems.
When compensation committees look into pay equity without external pressure from a shareholder proposal, a much better climate exists for asking thoughtful business questions that can inform decision-making. Systemic discrimination may exist, but the more realistic situation is finding isolated problem areas. A self-initiated pay equity study therefore can serve as a playbook for HR executives to examine where (and if) business processes have broken down and caused problems. Tackling problems before they get out of control is far more effective than firefighting.
Be skeptical of superficial analyses. Checking boxes is unlikely to reveal granular insights that can improve human resources practices up, down, and sideways within the organization.
One example of a superficial analysis is checking whether average salaries between different demographics are materially the same. These statistics might be refined with job grade information to gain additional granularity. For example, suppose the average female earns $60,000 and the average male earns $64,000. A simple analysis could conclude there is a problem and cause a company to adjust compensation so the numbers balance once recomputed.
An approach like this is prone to what, in statistics, are called Type 1 and Type 2 errors. A Type 1 error concludes there is a pay equity problem when there really isn’t one. A Type 2 error fails to identify a pay equity problem when there really is one. Both types of errors arise from using simple analyses that fail to capture what’s actually happening in a complex environment full of moving parts.
Calculating averages, for example, often is too crude given what else might also explain pay. Even after holding role constant, pay differences could reasonably exist due to experience, scholastic achievement, or performance ratings.
Regression analysis is a more appropriate way to examine the effects of these variables, many of which are entirely adequate and non-discriminatory explanations for pay differences. But even a regression analysis can quickly become biased if key variables are omitted. Consider the following case, which depicts male and female workers (all holding the same role) who work in either Kansas City or New York:
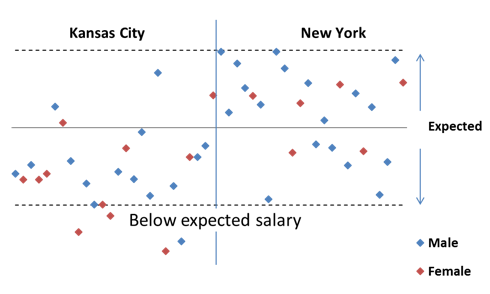
Figure 1: Salary Distribution of Male and Female Workers by Location
The two dotted lines denote a “strike zone” representing a compensation level in which any differences are considered statistically insignificant. Potential problem cases are the six people on or below the bottom dotted line, as the model doesn’t explain them. One conclusion is that there might be discrimination. Since four of the six cases are female, this statistic is troubling.
But adding location as a variable could explain all the pay differences. In this example, it turns out that fewer females work in New York than in Kansas City, where salaries are systematically lower. Omitting location from the model resulted in a Type 1 error: The conclusion that there is a pay equity problem when a benign variable like location was the true explanation.
Of course, biases may be run in the other direction and be even deeper than imagined. Suppose, for instance, a regression model shows that most individuals are within the strike zone.
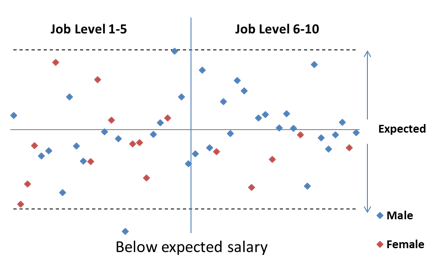
Figure 2: Salary Distribution of Male and Female Workers by Job Level
But after layering in job-level indicative data, we find the company rarely promotes females past job level 5. Furthermore, none of the females in job levels 6 and above are paid above the model’s predicted compensation level. While no model is ever 100% conclusive, this could suggest a glass ceiling, even though average pay levels fail to identify an issue.
Averages also can hide some very important relationships. Knowing that performance ratings can be biased, suppose we test whether they’re comparable between men and women on average. In the graph below, men and women both receive an average 5.7 rating.
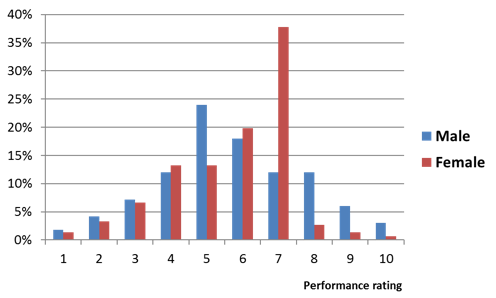
Figure 3: Male vs. Female Performance Ratings
But on closer examination, we see that women rarely are rated above a 7 out of 10. The average of 5.7 could mask an entirely different problem—a problem that arises in the rating system—and this problem could contribute to a glass ceiling phenomenon.
Simplistic math can tell a deeply flawed story of what’s happening in an organization. Well-designed studies won’t solve this problem. But they can show business leaders where to look for a solution.
In our experience, this is more consistent with how the world actually works. More often than not, if there is a pay equity problem, it will be concentrated in specific pockets of the organization rather than across every division and office. It may or may not be conscious. Sometimes a pay equity problem might jump out of the data. Usually, though, it takes more robust analysis to sort it all out.
A check-the-box approach toward calculating pay averages is tempting, but may do little to uncover problems lurking beneath the surface. Equally risky, it could suggest a problem where none really exists. We encourage companies to give business and HR leaders a playbook for when they should ask more questions. This approach, while more time-intensive, is also more effective because it’s repeatable and allows firms to assess whether any reforms have had a real impact.
