Subscribe to Our Newsletter
Hear more from Equity Methods: Your trusted partner in equity compensation excellence.
The first of the pay ratio disclosures are on the horizon. What has it been like for companies to prepare? Between our just-completed biennial survey and some other polling we’ve done, we’ve picked up five key insights.
Right now, we’re just a couple of weeks away from the end of the year and more than two months into the formal calculation window for calendar-year companies. This means most companies at least have their analysis off the ground.
Where do you stand in your pay ratio preparations?
While very few companies have completed their analysis, almost all have at least started.
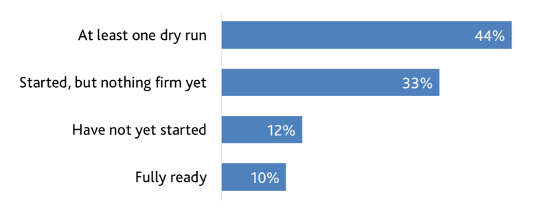
Using the most recent data we have (from our November 30 webcast with Hogan Lovells), we’ve found that over half of companies have made major progress—in either completing a dry run or making their final median selection—and a substantial majority have at least started their analysis.
With the clock ticking, calendar-year companies that haven’t yet started are already behind their peers. Even companies with late fiscal years should consider a dry run as soon as possible so that they’re fully prepared once other firms begin releasing their disclosures.
Our survey, perhaps as expected, shows that different companies are determining the median via a wide variety of consistently applied compensation measures (CACMs). A plurality will be using a broad definition, such as gross taxable earnings. Many others will be using different combinations of pay components, as reflect their organization and practices.
What’s particularly interesting, though, is why companies chose these CACMs.
Why did your company select the CACM that you did?
Pragmatism is key, without sacrificing quality.
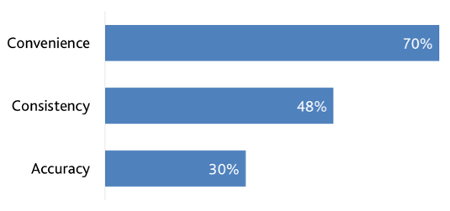
What the data shows is that most companies place a lot of value on a CACM that’s practical, citing reasons like convenience, ease of access, and already having certain information centralized for other purposes. Around half of companies offer reasons about pay practices that differ by role or region. Under a third cite reasons about the accuracy of the result.
A similar pattern of practicality appears around the “determination date” companies selected as the as-of date for their employee population.
What determination date do you intend to use?
Companies cluster around either their FY end date (when analytics are already occurring) or the earliest possible date (to give as long a runway as possible).
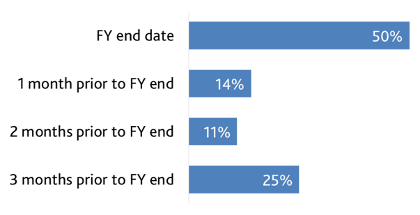
Again, pragmatism rules the day. Companies tend to either go as late as possible (to the last day of their fiscal year) or as early as possible (three months before the end of the year) for their determination date. Aligning with the end of the year may help with data gathering if similar analytics would be performed anyway. Performing the analysis as early as possible gives teams a more comfortable timeline, especially if the data is scattered globally. A final consideration that we often see, though it’s impossible to parse from raw data, is that companies with a large seasonal workforce often strategically select a date that minimizes the impact of that seasonality.
We’ve discussed the merits of sampling elsewhere—including in Workspan, our own publications, and countless presentations and conversations. While we’ve helped our clients with sampling where it makes sense, we often find that a full population analysis is both easier and leads to more reliable results. The data seems to show that companies agree with this point of view.
Are you using full population analysis or statistical sampling, and why?
Most companies are using full population over sampling, and they’re doing so because it’s easier and more accurate.
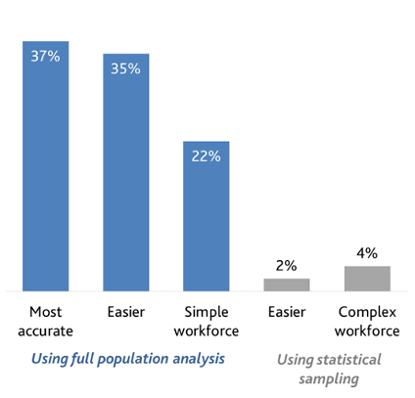
Interestingly, only a minority of companies cite the complexity or simplicity of their workforce in their decision to use full population analysis or statistical sampling. Even Fortune 100 multinationals say that full population analysis is easier, illustrating the challenges involved in sampling.
Every company’s pay ratio experience is different. Challenges can vary at every step. Even so, we do see a key theme around employee communications.
Among companies that had performed at least one dry run calculation—in other words, companies with enough hands-on experience to know where the challenges lie—communicating to employees is cited as the most common challenge. This is followed by gathering data and drafting the disclosure.
What do you expect to be your biggest challenge in your first year of analysis and disclosure?
Concerns are grouped around the front end of the process (gathering data) or at the back end (drafting the disclosure and communicating to employees).
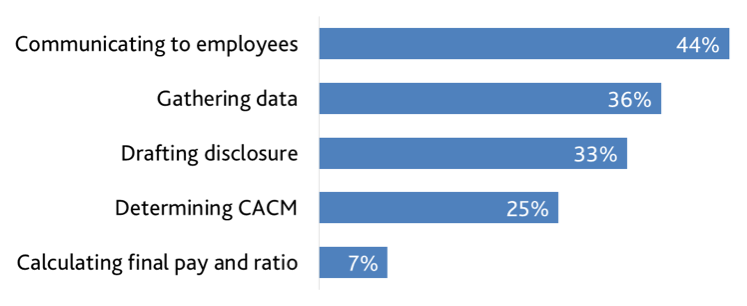
The results are even more interesting when we compare companies that had yet to perform a dry run with those that had done at least that much. (See above.) Communicating to employees is the only category that increased in concern; it seems that other expected concerns faded once they actually came to pass.
Underscoring our initial findings, most of our recent webcast attendees say that employees are the disclosure audience they’re most worried about.
Which of the following stakeholder reactions are you most concerned about?
For most companies, employee reaction is the primary concern.
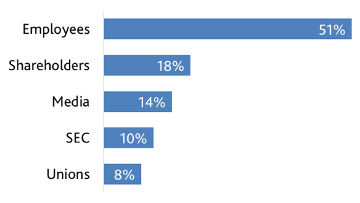
This squares with our anecdotal experience as well. Employees can have opposing concerns with the number. One is internal equity (“I thought I was a high performer. Why am I paid below median?”). The other is opportunity cost (“The company across the street has a higher median. Maybe I should interview there.”) This underscores the importance of having a thoughtful communication strategy in place before you or any of your peers releases a disclosure.
The question on everyone’s minds is unfortunately the most difficult to answer prior to disclosures.
What do you expect your pay ratio to be?
Pay ratios vary greatly by industry and by firm size.
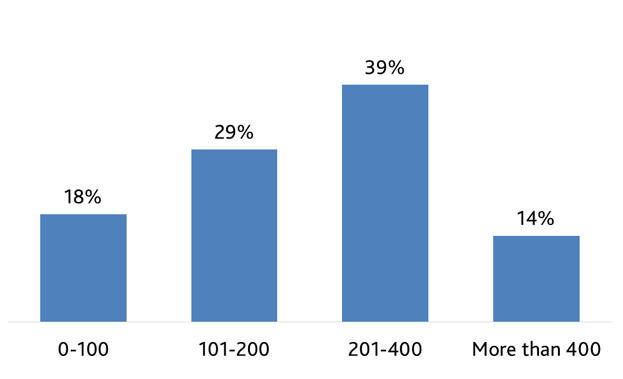
As a whole, the data backs up our expectation that most companies will have a ratio between 100 and 400. But that’s a wide range. Drilling down, we find that the biggest drivers of the ratio are industry and company size. Industry drives the denominator—the median pay. For example, technology and life sciences companies tend to have highly educated and specialized workforces. This means they tend to be highly paid, which drives the median up and the ratio down. Within an industry, company size or complexity tends to correlate with CEO pay. And of course, higher CEO pay drives the ratio up. Having this context about yourself and your peers can help you explain your results and how they compare.
More questions? As always, we’re here to help. We aim for a pragmatic approach to pay ratio analysis, tailored to your needs. Feel free to contact us or your Equity Methods consultant directly.
