Subscribe to Our Newsletter
Hear more from Equity Methods: Your trusted partner in equity compensation excellence.
On August 25, the SEC released the final rule on the long-awaited pay versus performance disclosure required under Section 953(a) of Dodd-Frank. The rule adds Item 402(v) to Regulation S-K, which companies are required to comply with in proxy and information statements for fiscal years ending on or after December 16, 2022.
Among other things, Item 402(v) requires companies to:
Produce a new proxy table showing interim fair value measurements on all outstanding unvested and in-period vesting awards. This will be most complex for market condition awards and stock options
Prepare for the year-one disclosure, which must include valuations that cover the beginning and end of the last three years—for a total of four years of calculations
Track year-over-year fair value changes, compensation amounts across potentially changing groups of named executive officers (NEOs), total shareholder returns (TSRs) across potentially changing peer groups, and more
Provide a narrative or visual description of the relationship between a newly introduced measure of compensation and various measures of performance, including TSR, net income, and a company-selected measure
The final rule is sprawling. Its 234 pages pack a much bigger punch than the rule proposed in 2015 or even what the Gensler SEC proposed in January 2022.
This is the first in a series of blog posts on the topic. Today we’ll provide our initial take on the rule, an overview of the rule’s key elements, and an action plan that we suggest executing immediately. Smaller reporting companies (SRCs) face a pared-down rule, which we’ll cover in a future post.
Background and How We Got Here
The Calculations Behind the Disclosure
Other Important Considerations
The Dodd-Frank Wall Street Reform and Consumer Protection Act devotes significant attention to executive compensation, primarily under Title IX, Sections 951 to 957[1]. When Dodd-Frank took effect on July 21, 2010, the SEC and other federal agencies became responsible for implementing the law’s provisions.
That was five SEC chairs ago. A proposed rule for disclosing executive compensation was initially released in April 2015 during Mary Jo White’s tenure as the SEC chair (three chairs back). Even though White also served under a Democratic administration, this SEC has applied its own touches to the rule based on further outreach, new comment letters, and overall learning since 2015. One can only imagine how different the final rule is from whatever the Jay Clayton SEC may have envisioned (but never enacted).
The pay-versus-performance disclosure is basically a composite framework of realizable and realized pay. It will complement the Summary Compensation Table (SCT) disclosure, which depicts the deal struck at grant without any mechanism for showing how performance-based features operate to index pay to performance.
The SEC’s aim has been to craft a rule that meets the Dodd-Frank mandate for companies to disclose “information that shows the relationship between executive compensation actually paid and the financial performance of the issuer, taking into account any change in the value of the shares of stock and dividends of the issuer and any distributions.”
Yes, that brief directive is essentially what’s behind this 234-page rule.
The operative term driving the pay-versus-performance disclosure is “compensation actually paid” (CAP). There’s been a seven-year debate as to whether this means value at vesting, value at exercise, interim values between grant and vesting, or various other measures. There was also a debate between the use of fair value and intrinsic value.
In the end, the SEC chose to define CAP as the final value at vesting alongside interim measures of fair value between grant and vesting (as measured at each fiscal year end). The result is a rule that shows stock returns and pay increases over a matched period, but at the cost of considerable incremental complexity. Let’s walk through what’s actually required.
We’ll begin with the crux of the disclosure, which is a new table hitting the proxy.
Here’s an example. (Hold tight, we’ll unpack the structure in the next section.) Note that in the first year, companies will have only the last three years, and then the disclosure will expand to five years moving forward. But, as we’ll discuss in future blogs, these tables could proliferate when you have multiple principal executive officers (PEOs).
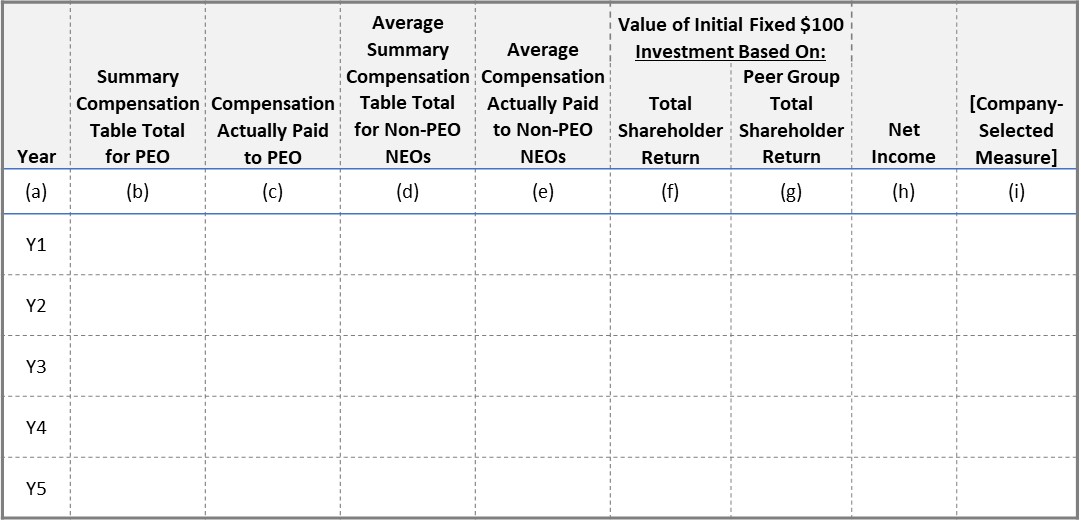
Table 1: Standard Pay-Versus-Performance Disclosure Table
You’re required to use the tabular information to provide “clear descriptions” of the relationships between CAP and three measures of financial performance. Those three are:
This relationship must be described for both the PEO and the average of the remaining NEOs, since ostensibly these two relationships could differ due to different incentive arrangements. The relationship must be looked at over the five most recently completed fiscal years (again, with the disclosure initially only looking back three years).
In addition, you’re required to provide a clear description of the relationship between your absolute TSR and the TSR of a peer group, also over the lookback period of the table.
The SEC writes that it’s possible to group any of these relationship disclosures, although any combined description must be “clear.”
Finally, there’s a requirement to provide an “unranked list of the most important financial measures used by the registrant to link executive compensation actually paid to the registrant’s NEOs during the last fiscal year to company performance.” This is subject to a minimum of three and maximum of seven measures. As long as you use at least three financial measures, you can add non-financial measures. The most important measure in this list should be the company-selected measure (CSM) that populates the final column in the table.
This last dimension of the disclosure is peculiar and is complicated by the fact that compensation actually paid in any given year is a function of different metrics spanning a panel of awards granted in different years. It’s conceivable that the largest driver of compensation actually paid could be value upticks or downticks linked to prior year awards. It’s also plausible that stock price performance will be the most salient metric for virtually all companies with equity-based awards. But is stock price a financial measure in the context of the specific rule language?
While this would be a prime area for a C&DI, we think the starting point is to focus on the award metrics embedded in the current year’s annual plan and long-term incentive plan, and to gauge which of those metrics explain most of the movement in CAP.
Supplemental disclosures are allowed under the final rule. As always, they must be clearly identified as supplemental, not misleading in light of the required rules, and not presented more prominently than the required disclosure components.
As you can see in Table 1 above, columns (b) and (d) tie cleanly back to what you’re already disclosing in the SCT. Columns (c) and (e) are where most of the calculation action takes place, as these involve adjustments to reported SCT values. We’ll walk through the calculations one by one, beginning with equity awards where we see the greatest level of complexity.
The equity awards calculations also reflect the largest modification to the proposed rules. In the proposed rules, you would follow this basic deduct-and-add approach:
That was the proposed rule. The final rule is more complex. In the proposed rule, the primary complication was fair valuing stock options at vest, since an out-of-the-money option that’s midway through its life requires different assumptions from new, plain-vanilla option grants.
When valuing options that aren’t newly granted (e.g., for modification purposes), we often apply a lattice model that can relate the expected life assumption to the option’s moneyness and remaining life. We do this even if Black-Scholes was initially used. In-the-money options would be expected to be exercised earlier, whereas out-of-the-money options may have an extended term. We don’t get the sense that the SEC would mandate use of a lattice model, though we think it’s easier and will yield more consistent and reliable measurements year over year.
The final rule is more complex than the proposed rule by requiring a more elaborate deduct-and-add approach so that all outstanding unvested and in-period vesting award are fair valued as of the fiscal year end date (or their vest date, if sooner). This is where all the interim fair value measurement calculations come into play. Fortunately, valuation specialists have developed tools and processes for these cases, such as when dealing with liability-classified awards.
Let’s walk through each use case involved in this more elaborate add-back approach.
Use case #1: equity awards granted during the year that are outstanding and unvested
Treatment: Year-end fair value
For options, this may require using a lattice-based modeling approach described above.
For TSR awards or any awards with a market condition, the Monte Carlo simulation used to initially value them must be retooled to produce an interim period fair value.
For awards with a performance condition, the fair value will be the stock price as of the fiscal year end, provided that the performance condition is deemed probable as of this date.
For stock awards (including performance-based and market-based awards), the value of dividends or dividend equivalents accrued through the end of the fiscal year.
Use case #2: awards granted in prior years that are outstanding and unvested
Treatment: Change in fair value
The same treatment approaches as above apply, except the comparison is to the change in fair value.
Suppose an award was granted in 2021 with an interim fair value of $15 as of 12/31/2021 and an interim fair value of $18 as of 12/31/2022. The differential of $3 would be used.
For awards with performance conditions that are deemed probable at the end of the year, the consideration is they will be measured as if they are probable at the beginning and end of the period.
Use case #3: awards granted and vesting during the year
Treatment: Full value of award at vest date
For standard full-value awards, this will be the realized pay amount as of vesting (e.g., no Monte Carlo simulation for TSR metrics).
For options where the award is vested but still exercisable, this may involve lattice modeling as described above.
Use case #4: awards granted in prior years that vest during the year
Treatment: Change in fair value
This is a combination of use case #2 and #3 in that the fair value as of the vesting date is used.
Use case #5: awards granted in prior years that do not vest
Treatment: Change in fair value
This would include a forfeiture or award with a performance condition where the vesting is reclassified to be “improbable.”
This same outcome will automatically happen to an award with a market condition in the Monte Carlo simulation as the condition becomes increasingly unattainable.
Use case #6: dividends or similar paid on stock and options that aren’t embedded in the fair value
Treatment: Actual amounts paid
These are actual amounts delivered to the employee, but should not be counted if the fair value estimates in the prior calculations also capture these same amounts.
We’ll be writing about these topics much more in the coming weeks and months. Here are a few final takeaways:
The treatment of pension plans also took a turn for added complexity in the final rules. The SEC included a convenient table to clarify how the final rules depart from the proposed rules:
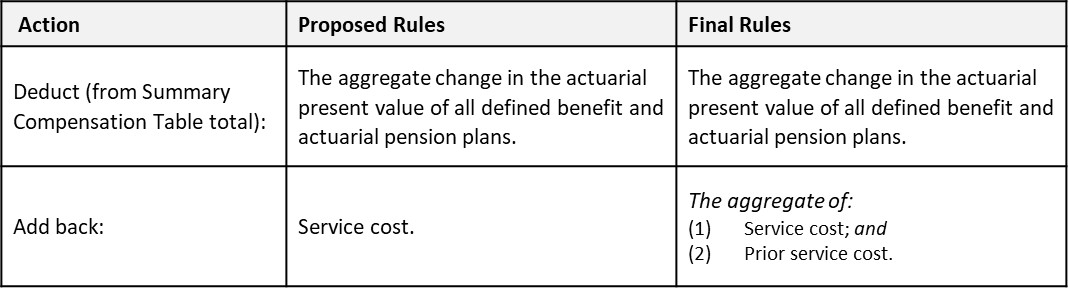
Table 2: Pension Plan Treatment Under Final Rules
We’re not pension plan experts, but our understanding is that the inclusion of prior service cost isn’t a large expansion of complexity because this is already calculated alongside service cost. The benefit of this expanded approach is that it more cleanly incorporates the entire effect of plan amendments that take place during the year. Our understanding is that companies will engage their outside actuarial vendor for these values and that the addition of prior service cost would be a standard deliverable.
The final rule matches the proposed rule by requiring that above-market or preferential earnings on NQDC plans be included in the overall measure of compensation actually paid.
Before closing, let’s walk through some other dimensions of the final rule.
We said it before, but let’s say it again: This rule is going into effect for all companies with fiscal years ending on or after December 16, 2022. As noted earlier, SRCs benefit from a pared-down disclosure framework. Foreign private issuers, registered investment companies, and emerging growth companies are exempted.
There’s general flexibility on where to put this disclosure in the proxy.
The disclosure is subject to broad XBRL tagging. Each value disclosed in the required table must be tagged separately. The relationship disclosure must be block-text tagged, and the same is true for footnote disclosures.
Issuing companies should plan on broad footnote disclosures, ranging from valuation assumptions to NEOs aggregated for each fiscal year.
Turnover of the PEO will substantially broaden the table as separate disclosure is required for each PEO instead of the initially proposed approach of aggregating PEOs.
There’s limited discretion over which TSR peer group to use. Companies may choose either the peer group used for Item 201(e) of Reg S-K, or the peer group used in the CD&A for benchmarking.
Peer group TSR is a weighted-average calculation. It uses the peer firms’ market capitalizations at the beginning of each period (for which there’s a return) as the weighting factor.
Changes to the peer group require adjusting the disclosure table for all years to reflect the new peer group, disclosure of the reason for the change, and a comparison of your TSR to the TSRs of both the old and new peer group.
TSR is measured in the same way as it is for Item 201(e), which takes the market closing price on the last trading day before the registrant’s earliest fiscal year in the table through, and including, the end of the fiscal year for which TSR is being calculated. TSR is calculated as a fixed investment of $100 at the measurement commencement.
The net income disclosure is total net income as reported under GAAP. There’s no longer any disclosure of income before income tax expense. Non-GAAP renditions aren’t permitted.
The Company-Selected Measure must be a financial performance measure included in the tabular list of most important financial measures. Non-GAAP metrics may be used, but disclosure will be required as to how the metric is derived from the audited GAAP financials.
Feel a headache coming on? Good tracking beats Tylenol, and one of our strategies will be to manage a time-series dashboard that monitors all the moving parts of equity awards.
Change requires tracking. Undoubtedly, valuations will change from period to period and across each award type. NEOs will enter and exit the grouping; if the PEO changes, this will add columns, and when non-PEO NEO changes occur this will affect the averaging process. Performance condition outcomes need to be folded into the tracking. Peer group changes must also be tracked carefully.
A time series is a comprehensive table that keeps track of such shifts. Here’s an example that tracks a single PEO with RSU grants only. The purpose is to capture all the relevant information in one place so that you can automate the calculations used to produce the required tabular disclosure.
![]()
Table 3: Example Time Series Tracking Table
Each color and band of rows shows the repetition of outstanding awards with updated interim fair values. The fair values on each date are the same because this is an RSU, but obviously the total values would differ if there were market or performance conditions present, or if these were stock options. Off-cycle grants, multiple PEOs, and the inclusion of the average non-PEO NEO compensation will materially expand this table. Our plan is to track and manage this time series for our clients.
We have many thoughts about the final rule, some of which we expressed here and others which we can share over a coffee or other refreshment of interest.
Overall, we expected something much more akin to a realized pay disclosure like the framework contained in the initial exposure draft. On the other hand, the entire premise of fair value accounting is that the users of financial statements don’t want to wait until the end of a measurement period to learn about the results—they want something more fluid to be presented during interim periods. What would the authors of Dodd-Frank have opted for? We’ll never really know, given that the Dodd-Frank legislation in Section 953(a) is only 110 words.
The journey to this final rule involved fierce debate over the merit of fair value versus intrinsic value. There’s also been a debate about whether to provide interim measures of realizable pay or a point-to-point depiction of realized pay. The final rule attempts to strike a balance among the statutory language in Dodd-Frank, presumptions about Congress’ intent, outreach with the users and preparers of proxy information, and the benefits of simplicity.
Could disclosures be weaponized? Possibly. Unlike CEO pay ratio, pay versus performance is purporting to answer a much more serious question: Do performance-based incentive plans actually tie pay to performance?
At Equity Methods, we study the relationship between pay and performance a great deal. Sometimes it moves in unexpected directions due to timing disconnects or pure market noise. This doesn’t imply poor compensation decision-making. It’s simply that compensation policy operates in a world where neat cause-and-effect relationships can’t consistently be counted on.
So what should you do now? Consider taking the following steps:
At this juncture our focus is operational—on how to help our clients, industry friends, and other stakeholders execute the final rule without hiccups. We’ll be publishing much more on this topic and invite you to sign up for article roundups and webcast invitations at www.equitymethods.com/subscribe.
If you’d like to discuss these topics with us, please don’t hesitate to reach out, either to me or to your point of contact at Equity Methods.
[1] To give you a sense of proportion, Dodd-Frank is an 849-page law passed by Congress. The SEC’s recent rule to enact Section 953(a) is 234 pages and the CEO pay ratio rule to enact Section 953(b) is 294 pages. There are 1,601 sections in Dodd-Frank. This might prompt you to wonder how many pages of rules have been produced as a result of the initial Dodd-Frank legislation.
[2] Examples include this blog on how realized performance disproportionally influences valuation, an issue brief devoted to synchronizing the grant date and performance start date, and this brief summary that runs through each award type.
[3]For a standard company with options and TSR awards, the annual option and TSR award is usually fair valued a few months after the start of the fiscal year. Excluding off-cycle grants, there will usually be three outstanding TSR designs and three outstanding and unvested option grants, which will require a total of six interim fair value calculations to be performed as of the fiscal year end date. Any off-cycle grants will be in addition to this.
Download This Article
Pay Versus Performance Is Here, Part 1: Overview and Action Items
