Subscribe to Our Newsletter
Hear more from Equity Methods: Your trusted partner in equity compensation excellence.
It’s now been a few weeks since the SEC released the final pay versus performance (PvP) rule. We published our first article on the topic four days post release. Since then, we’ve had hundreds of client discussions and kicked off multiple process development initiatives.
Our first article looks at the rule’s principles and parameters, how companies are rushing to prepare mock-ups of the key table, and actions to take in advance of live disclosure in 2023. Here we look at the logic and mathematics behind the core disclosure table, using a basic case study to illustrate the many moving parts.
Whereas equity valuations can involve complex mathematics, table production is about gymnastics. We’ll begin with a recap of the different use cases underpinning the calculation of compensation actually paid (CAP) and how each one merits different treatment. Next, we’ll walk through a process beginning at the point of grant of an award and ending at its final vesting to show how the interim fair value measurements impact the determination of CAP in any given year. Finally, we’ll offer commentary on additional layers of complexity, such as different award types and named executive officer (NEO) turnover.
Whether you plan to calculate the table values yourself or engage us to do this, the year-by-year walkthrough in this paper will help illustrate the factors that can introduce volatility into CAP. One of the most critical dimensions of the PvP disclosure will be the “clear description” offered of the PvP relationship immediately beneath the core table. Possessing an understanding of the ingredients behind CAP will help you explain surprising changes in values and develop clear analytics for both the disclosure itself and your management team.
We recommend that calendar year companies complete full table mock-ups as soon as possible. In fact, much of the valuation work behind the live 2023 table can be performed now and reused next year. After developing a table mock-up, you’ll be able to have a much more tangible discussion on the strategic considerations, such as how to develop the narrative (or graphical) disclosures that must accompany the table and whether to include supplemental analytics. You’ll also be able to establish roles and responsibilities with internal stakeholders and outside vendors to avoid fire drills in 2023.
The Ins and Outs of Compensation Actually Paid
Case Study: Single RSU Award to a Single PEO
Case Study Plus: Annual RSUs to a Single PEO
Remember that the purpose of the disclosure is to describe the relationship between CAP and company financial performance. This means adding a new tabular disclosure to proxies covering fiscal years ending on or after December 16, 2022. We’ll call this the PvP table.
The central requirement is to compare CAP to three measures of performance:
The calculation of CAP requires interim fair value remeasurement, which is a departure from both of the SEC’s prior proposals. Company TSR must also be compared to peer group TSR in the disclosure. The summary compensation table (SCT) measure of pay is included in the table for basic comparison purposes.
The new disclosure table stands to be the most complex table in the proxy (Table 1). In our first article, we walked through the six equity award use cases that need to be considered in populating equity values, in addition to the treatment required for pensions and non-qualified deferred compensation (NQDC) plans.
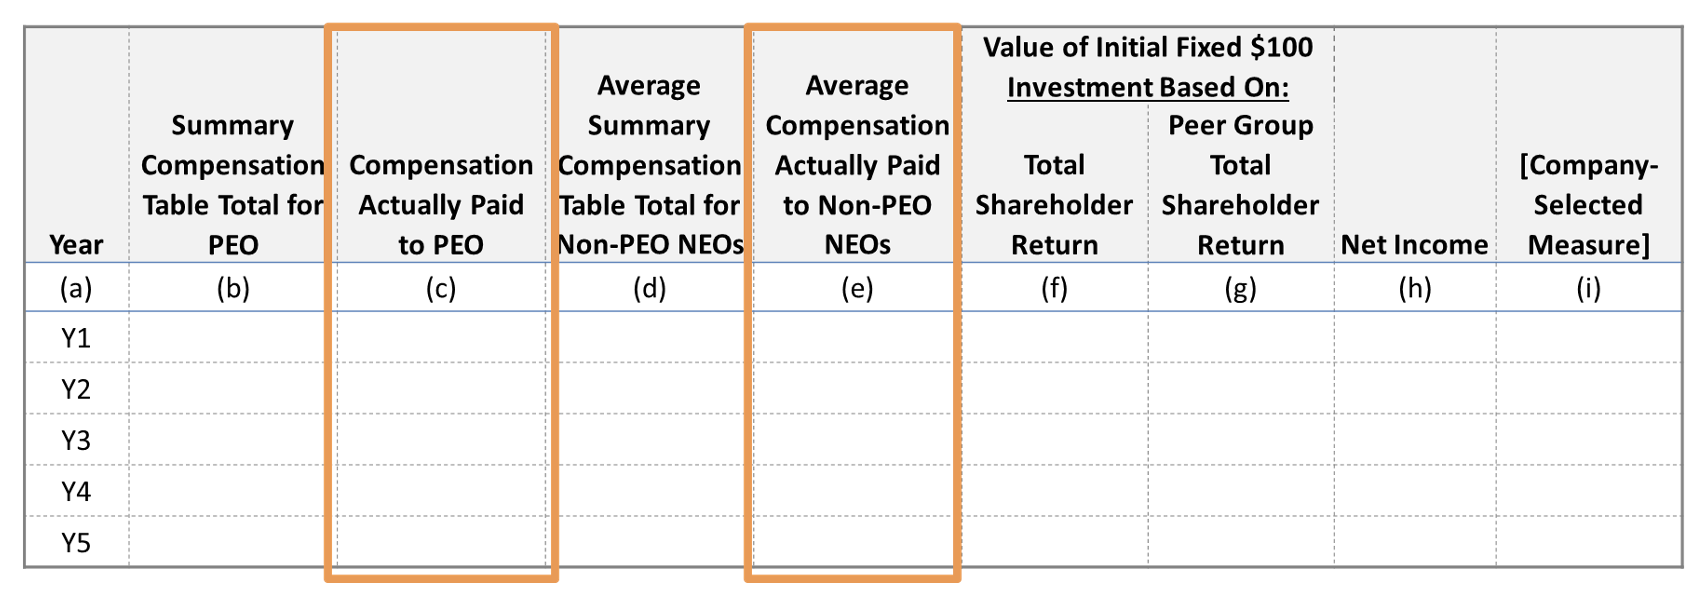 Figure 1: The PvP Table
Before we get into our sample calculation for a single grant of restricted stock, let’s set up the various interim fair value measurements needed to produce the table. We touched on these in our first article, but given their importance and complexity, we’ll go into more detail here.
The initial 2015 proposed rule introduced the new pay measure, CAP, which was intended to be a variation on realized pay. In the final rule, CAP has become a composite measure of both realized and realizable pay. The goal behind CAP is to capture the incremental pay that stems from one more year of service and the upward and downward evolution in that pay opportunity over time.
Specifically, the methodology begins by establishing a baseline value on an award in the year it’s granted. The baseline value should be as of fiscal year end (unless the award vests earlier). Incremental value changes are calculated for outstanding awards in the years subsequent to their grant, and those changes are measured as of fiscal year end (unless the award vests earlier). Finally, dividends that are omitted from the fair value calculations are added in.
The specifics of dividend handling have been a hot area of inquiry; stay tuned for a future blog post devoted to the topic.
This methodology requires looking at past and present awards, awards vesting in period and in future periods, awards forfeiting, and awards generating dividends. The level of granularity underpinning the methodology requires a comprehensive approach to tracking.
One way to think about the CAP calculation methodology is that the cumulative value disclosed per award across time should equal the final value delivered at vest. Disclosing the full fair value each year would intertemporally double-count value. At the same time, disclosing only changes in value (from the start) would under-count by failing to establish an initial baseline. Focusing on the cumulative value across time offers a convenient check figure on the math.
The SEC rule’s explanation of how to calculate CAP begins on page 56 and runs through page 65. Some have found the language confusing, so to help bridge the theory to the nuts and bolts, we find it informative to break the process into six distinct calculation components. These help us ensure we’re applying the right calculation treatment to each distinct award and NEO situation. Table 1 shows these use cases and immediately following the table is a more descriptive analysis of each one.
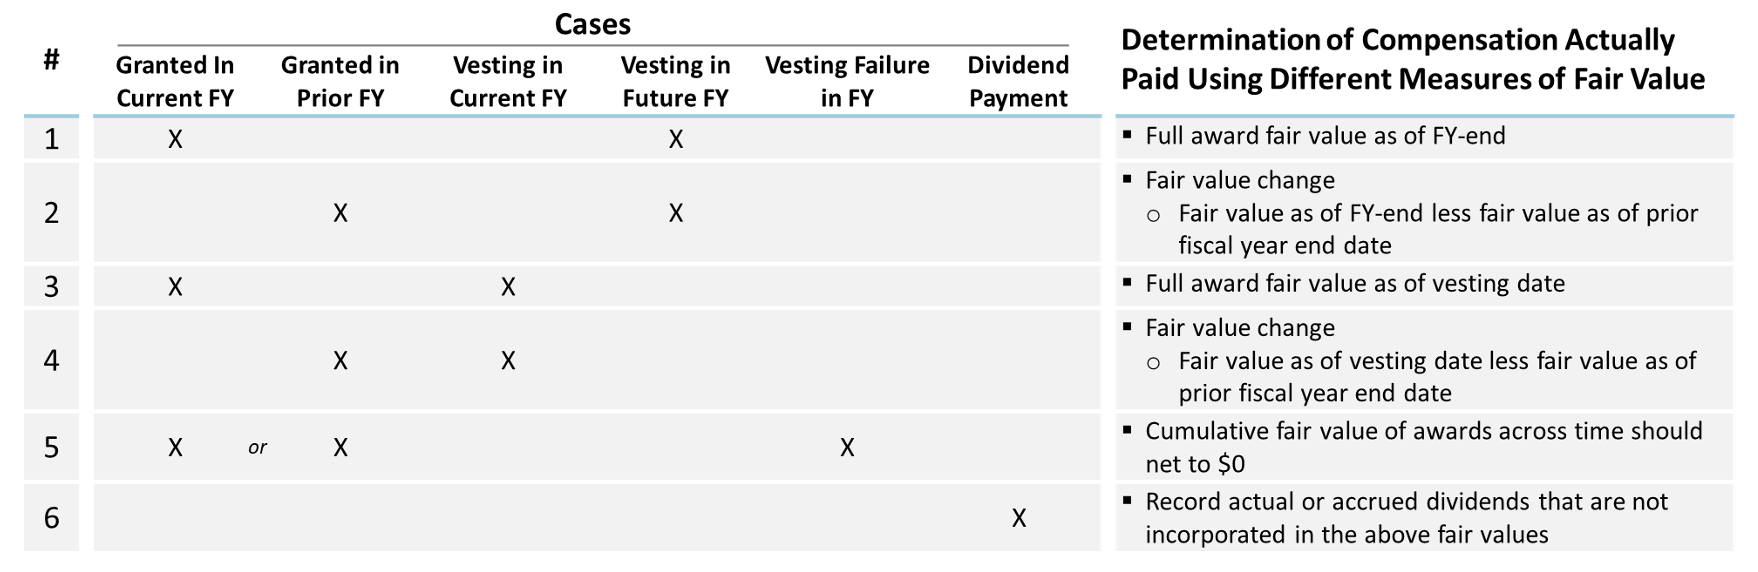
Table 1: Use Cases for Tracking the Value of an Equity Award
Here’s a list of the use cases and how the calculations operate for each one.
1. The year-end fair value of any equity awards granted in the covered fiscal year that are outstanding and unvested as of the end of the covered fiscal year
2. The change as of the end of the covered fiscal year (from the end of the prior fiscal year) in fair value of any awards granted in prior years that are outstanding and unvested as of the end of the covered fiscal year
3. For awards that are granted and vest in the same covered fiscal year, the fair value as of the vesting date
4. For awards granted in prior years that vest in the covered fiscal year, the amount equal to the change as of the vesting date (from the end of the prior fiscal year) in fair value
5. For awards granted in prior years that are determined to fail to meet the applicable vesting conditions during the covered fiscal year, a deduction for the amount equal to the fair value at the end of the prior fiscal year
6. The dollar value of any dividends or other earnings paid on stock or option awards in the covered fiscal year prior to the vesting date that are not otherwise reflected in the fair value of such award or included in any other component of total compensation for the covered fiscal year
For simplicity’s sake, let’s assume the following:
This simple award will appear in the year of grant at a value of $100,000 in the SCT, but spend the next four years in the PvP table. It’ll fluctuate in value each year until it vests or is forfeited; the cumulative value over time recorded will equal the ultimate value delivered. To that end, as Figure 2 shows, we’ll need to perform nine unique valuations over the life of this award (unless it forfeits prior to vesting).
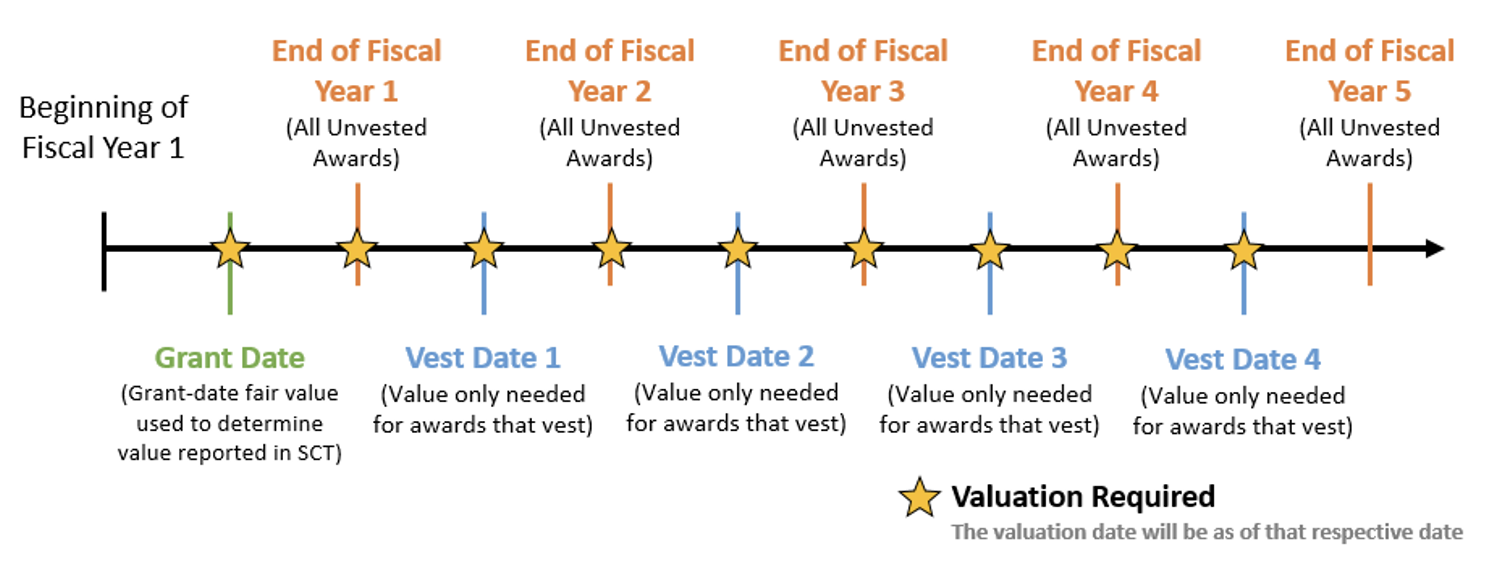
Figure 2: Valuations over the Life of an RSU Award to a Single PEO
Now let’s dive into how each of these valuations will impact the value reported in the new disclosure table.
In year 1, our first valuation will be the grant-date valuation just as we always do. CAP will be the second valuation performed, which is a fair value measurement as of fiscal year end. The grant-date valuation will enter the table via column B, representing the SCT amount for comparison purposes alongside column C (CAP).
To compute CAP, let’s assume the stock price has increased to $11 as of the fiscal year end. This yields a total value of $110,000 in column C for year 1 (Table 2).
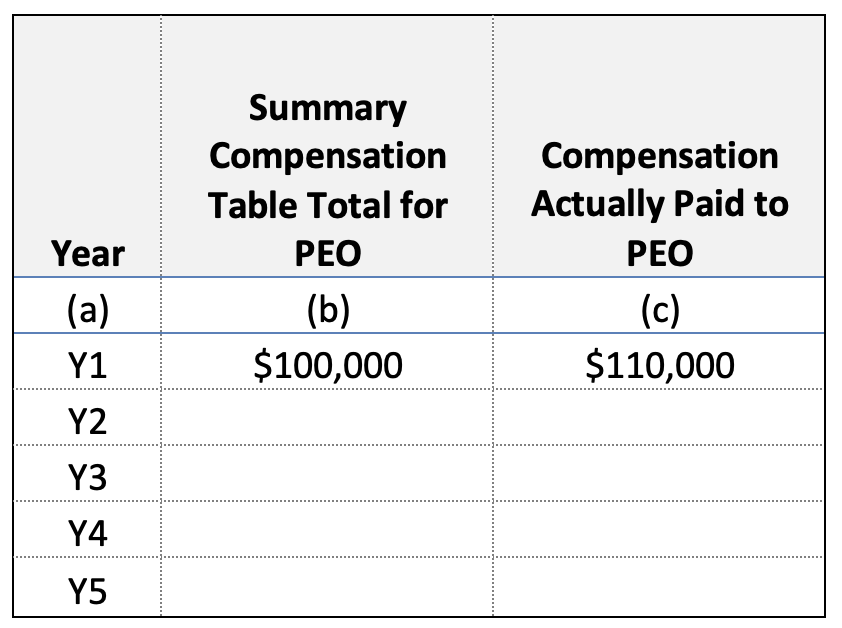
Table 2: Disclosure in Year 1
In the second year, things get more complicated. We have two valuations to consider, our vest-date valuation and our fiscal year end valuation. These valuations apply to tranches one and two, respectively. Importantly, both of these valuations now fall under the “incremental” rules (components two and four of the rules above, respectively).
On the vest date, let’s assume the stock price has increased again, this time to $12. Our first step is to calculate the incremental price change from the prior valuation to the point of vesting. In this case, the last valuation was as of the end of fiscal year 1, when the stock price was $11. So, our incremental value per share is $1 ($12 – $11).
However, this incremental calculation is applied only to the awards that vest. Since the award vests in four equal tranches, that means 2,500 units are vesting this year. This leads to a disclosure impact of +$2,500 (2,500 units @ $1 change).
For the next part of the calculation, we need to fast forward to the end of fiscal year 2 where we handle the components of the award that didn’t vest during the year. Let’s assume the stock price appreciated again, this time to $13. Once again, we compare this current valuation to the prior valuation of $11. Still operating under the incremental framework, we calculate an incremental change of $2 ($13 – $11) per share and multiply it by the 7,500 unvested RSUs (for a positive delta of $15,000).
In total, this leads to a year 2 disclosure of +$17,500 in column C and nothing in column B due to our underlying assumption that no future grants are awarded (Table 3).
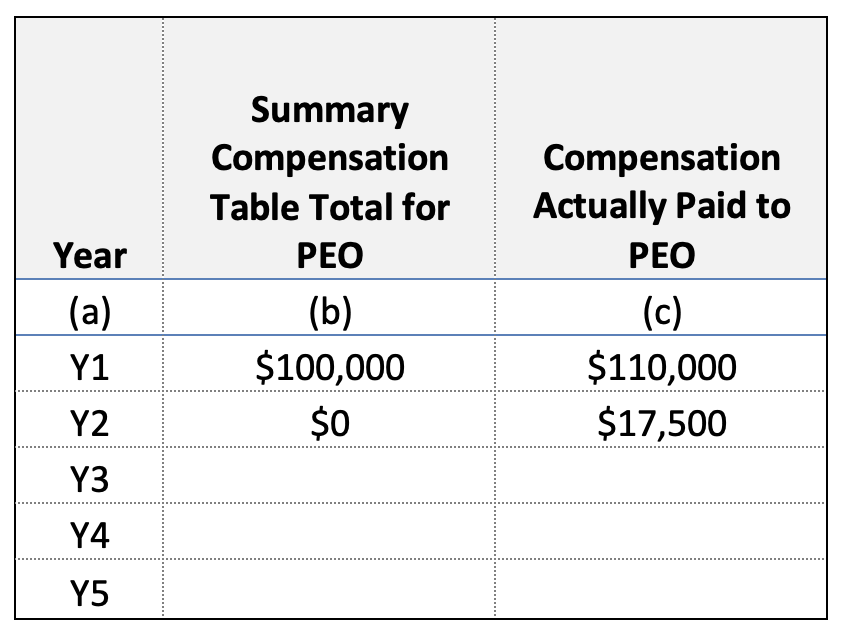
Table 3: Disclosure in Year 2
The process for years 3 to year 5 mimics what we just covered in year 2. But to make it interesting, let’s layer in a stock price decline in year 3. Again, we have calculations for the awards vesting in the year and those still unvested as of the fiscal year end.
Another 2,500 RSUs vest in year 3, and let’s assume the stock price declines to $10 on that vesting date. Those RSUs were last valued at the end of the prior fiscal year, so we‘ll compare our vest date price of $10 to the fiscal year end price of $13. The incremental value of the RSUs vesting in the period is -$3 ($10 – $13), which multiplied by 2,500 results in -$7,500.
Assume the stock price decline continues to $9 as of the end of fiscal year 3. Our incremental value for the 5,000 remaining RSUs is -$4 ($9 – $13), which results in a total change of -$20,000. So the total disclosure for year 3 is -$27,500 (Table 4).
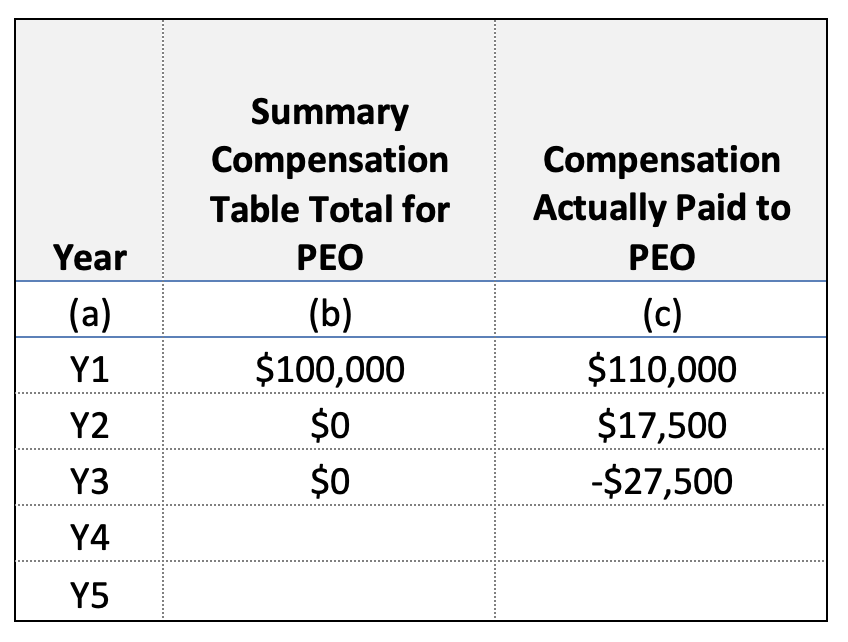
Table 4: Disclosure in Year 3
We’ve just covered an up-and-down case. Now let’s consider a scenario where the valuations are positive and negative in the same year.
Assume the stock prices surges initially so that when the next batch of 2,500 RSUs vest, the stock price is $15. Lather, rinse, and repeat: We compare the last pegged value for those RSUs of $9 to the vesting date value of $15 for an incremental change of $6 per share, or $15,000 total ($6 x 2,500).
Then the stock price plummets to $5 by the end of the fiscal year. For the remaining 2,500 unvested RSUs subject to this calculation, the incremental change is -$4 per share ($5 – $9), for a total of -$10,000. Our total entry for year 4 is $5,000 (Table 5).
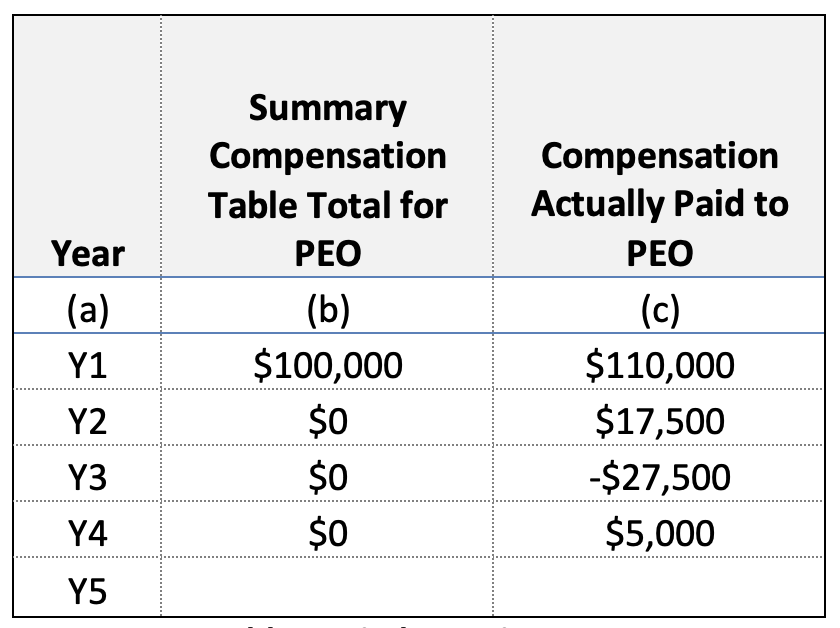
Table 5: Disclosure in Year 4
Finally, we reach the final valuation when the fourth tranche vests and the award is fully vested. Let’s assume the stock price rose again to $10, which is exactly where the story began. Our final incremental calculation would yield a per-share value of $5 ($10 – $5), which we would apply to the final 2,500 vesting units for a final entry of $12,500 (Table 6).
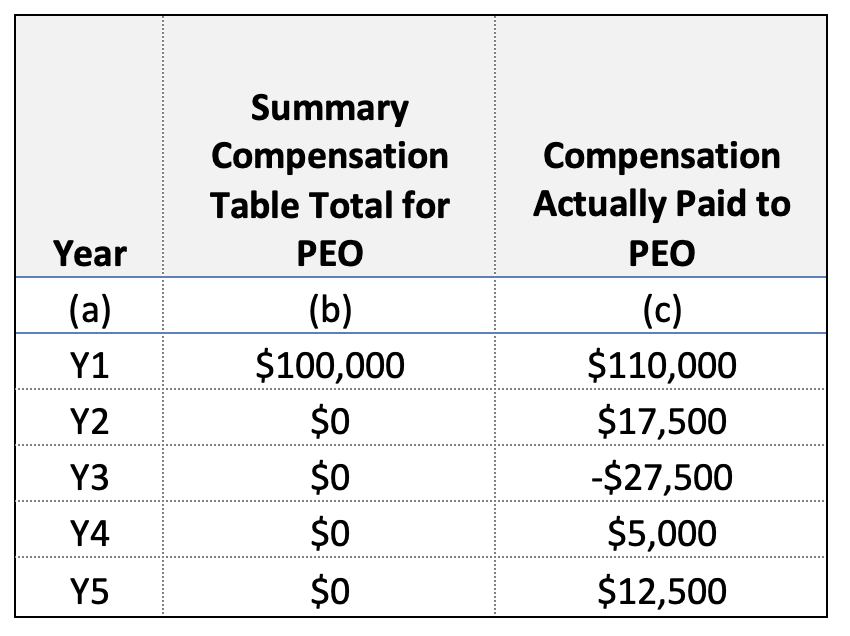
Table 6: Disclosure in Year 5
With a full slate of entries across time, you can see in Tables 7 and 8 that the total value of column C is equal to the total value of the awards that our PEO actually received. (If you remember, we said this is a good sanity check that the math is working as intended.)
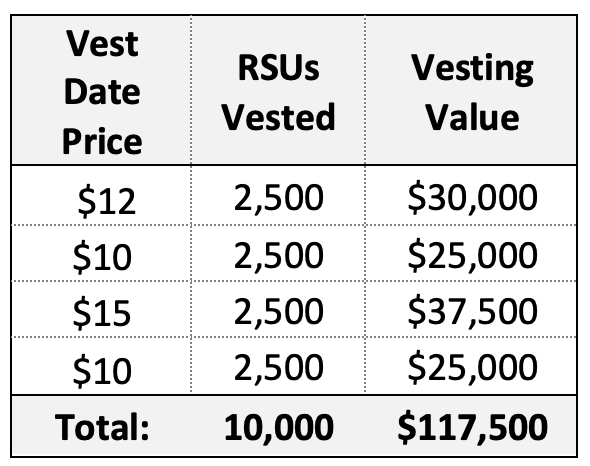
Table 7: Value of Vested Awards
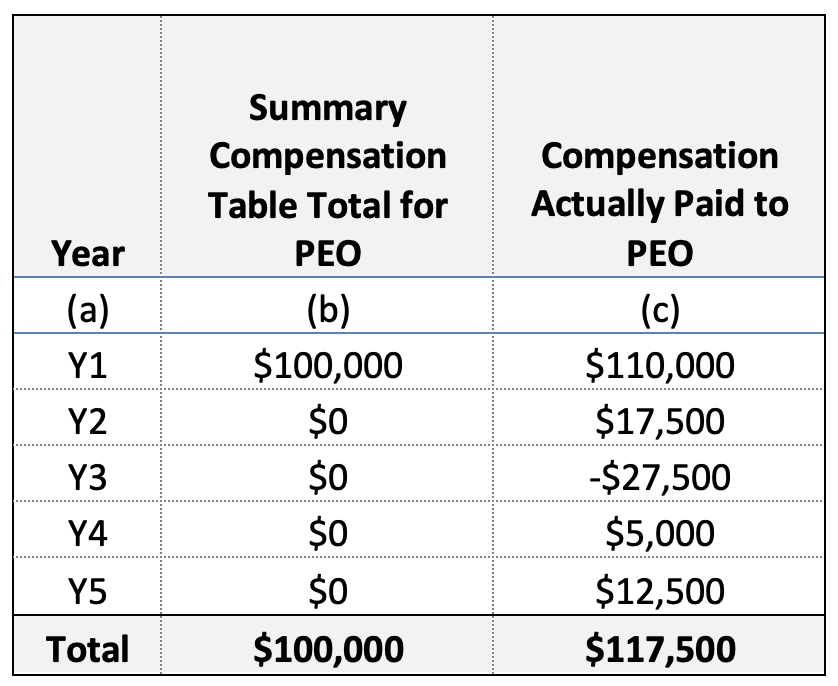
Table 8: Disclosure in Year 5 (Total Values)
The punchline is that no single element of the table composition is complex. What is complex is the interplay of elements that creates risks for double-counting and under-counting. One particularly fictitious element to our case study was the assumption of a single grant made in the present year. The challenge companies will face in their first year of adoption is performing and collecting the retrospective valuations on prior-year grants.
To illustrate this, let’s now assume $100,000 in RSUs has been granted annually and will continue to be granted into the future. Let’s also use actual years by assuming this is a calendar year company initially disclosing fiscal year 2022, fiscal year 2021, and fiscal year 2020 results.[1]
As we help clients perform these calculations, we begin with a table that captures all the grants requiring valuation, the fiscal year in the disclosure those grants affect, and the type of valuation needed (vesting [VD], fiscal year end [FYE], or forfeiture). In Table 9, we have a relatively simple table given the use of only one award type issued annually to only person.
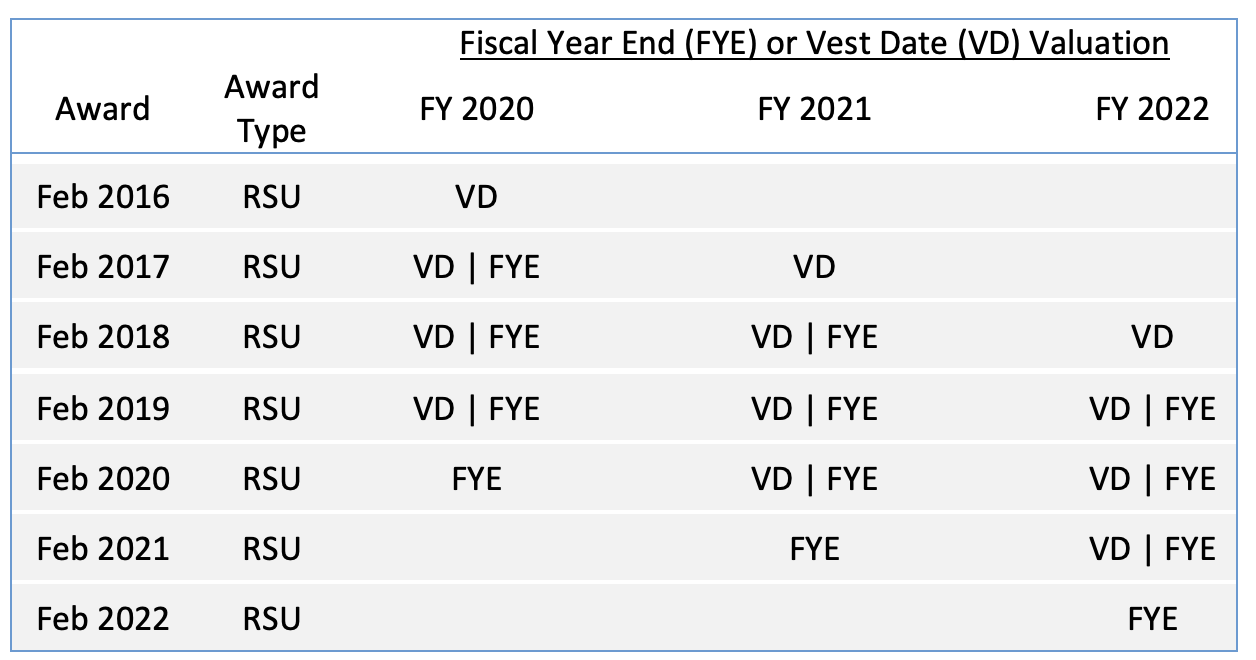
Table 9: Annual RSUs to a Single PEO
Once you organize all the requisite data appropriately, the next step is to build the table using the six distinct use cases from Table 1. Because of the overlapping calculations, many factors influence the way the final table will look. First, we need to calculate the incremental changes for each outstanding grant at each vest date and each fiscal year end date (Table 10).
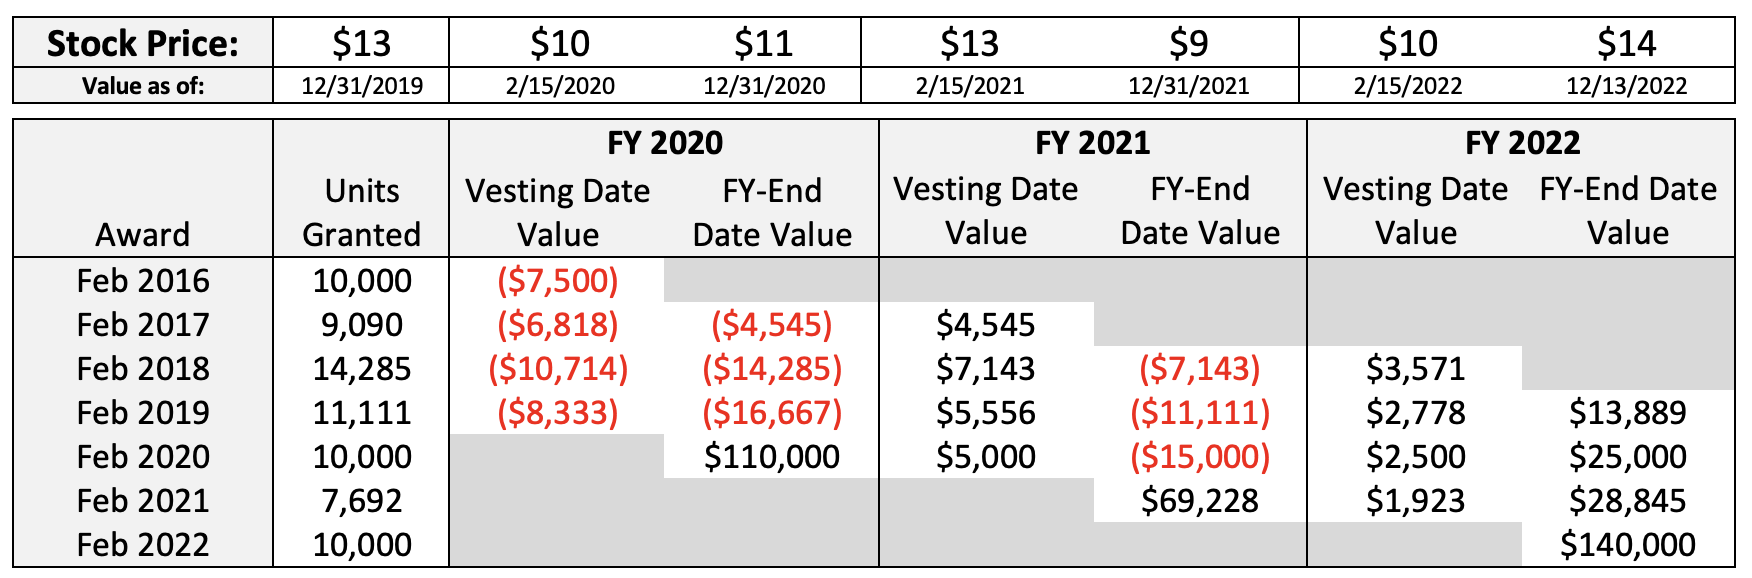
Table 10: Incremental Changes for Each Outstanding Grant at Vest and Fiscal Year End
Finally, all that work is boiled down into the disclosure table by summing the activity in each fiscal year (Table 11).
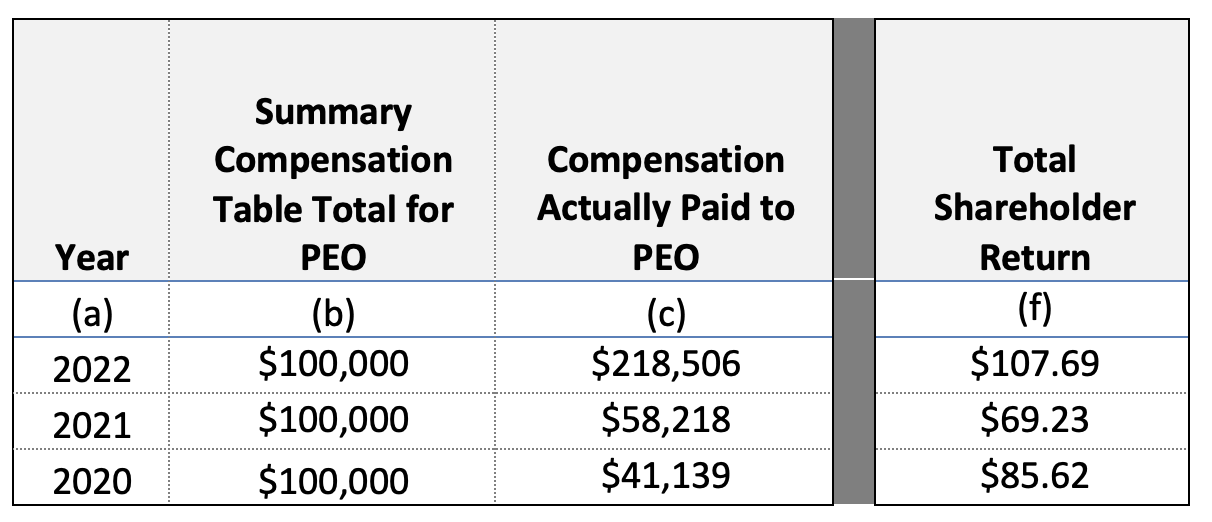
Table 11: Sum of Activity in Each Fiscal Year
The reported value in 2020 is below the SCT amount because, as you can see in Table 10, the stock price declined from fiscal year 2019 end ($13) to fiscal year 2020 end ($11). The cumulative incremental decrease for the 2016–2019 awards more than offset the newly granted 2020 award, even though the 2020 award appreciated in value relative to the grant-date/SCT value.
As you can also see, the strong rebound in price between fiscal year 2020 end and fiscal year 2022 end resulted in CAP rebounding to $58,218 in 2021 and $218,506 in 2022. The CAP for 2021 was positively influenced by the positive incremental change that occurred on the vest date valuations. That positive movement raised the CAP for fiscal year 2021, even though the incremental value for the outstanding awards between fiscal year 2020 and fiscal year 2021 ($9 – $11) year-end valuations was the same as the change between fiscal year 2019 and fiscal year 2020 ($11 – $13).
This is a simple fact pattern. In our client work, we frequently bump into contexts where there are sharp surges and declines within fiscal years that cause the total values to invert in surprising ways. This can clash with the TSR calculations, since these are simple cumulative calculations that use the first year in the table as a base year. The sooner you can mock up your own table, the sooner you can begin analyzing how to build a narrative around the unique movements and events in your own organization’s journey.
Now let’s discuss the other complicating factors impacting table production. These include more complex award types, off-cycle awards, NEO changes, and more.
We started our example with RSUs because they’re straightforward—their value is simply equal to the stock price. For other types of awards, like stock options and performance awards, we face additional considerations.
Performance awards will have different treatment depending on the type of condition they contain. Recall that under ASC 718, the governing accounting standard, performance awards are separated into two categories:
As with grant-date valuations under ASC 718, performance awards with a market condition must be valued using Monte Carlo simulation (or a similar technique) that embeds the economic effect of the market condition into the fair value. This means that a typical relative TSR award, with a three-year cliff vesting performance period, will require between four and five Monte Carlo valuations over its lifespan (depending whether the vesting date aligns with the fiscal year end).
For awards with performance conditions, the updated valuation will incorporate both the changing stock price and the current payout expectation for the award. The payout expectation should be taken from that used for expense recognition purposes pursuant to ASC 718. Similar to the above case, these awards will need to be reevaluated four to five times over their lives.
Stock options are another form of equity award that create a considerable amount of complexity within this new disclosure. A suitable option pricing model must be used to remeasure the fair value at each valuation date until the options vest.
However, the additional complexity related to stock options is compounded when using the Black-Scholes formula. Using Black-Scholes to value a newly granted option is generally straightforward because you can study the historical data to obtain an aggregate picture of how long employees hold their options from grant to exercise. Unfortunately, there are not consistently reliable ways to extrapolate that analysis to a non-newly granted option that is no longer at-the-money. In fact, this will need to be done to an entire panel of options—some early in their lives and some later, and all of them at different moneyness levels.
We’ll cover this topic much more thoroughly in a future blog post. Absent specific guidance from the SEC, our view is that there are certainly compliant ways to deploy Black-Scholes in this context, but a lattice model may simply be easier because it produces an expected term as an output in the context of the relevant variables influencing exercise behavior.
One concern we’ve heard in the market is that the exercise of performing retrospective valuations is impossible because it’s a fallacy to assert how a valuation would have been performed at a date in the past. But so much of valuation science is locking down a methodology that can be refreshed when and as needed. Technology also helps here. Let’s next look at some other challenge areas.
Beyond the different types of valuation models needed for different award types, complications arise from several other factors.
Off-cycle awards. As shown above, even a simple award can create sprawling valuation and tracking complexity. Off-cycle awards substantially expand the scope as they commonly have distinct vesting dates and related terms.
NEO changes. Because the disclosure also requires the average CAP for the non-PEO NEOs, it’s necessary to track the CAP for each NEO in each covered year. NEO entry and exit, either from the NEO list or the company itself (due to attrition), will introduce new awards and necessary filters to the calculations. Remember that footnote disclosure is required of the NEOs included in each year’s calculation.
Monthly vesting. Monthly or other granular vesting schedules add further administrative burden. For example, an option that vests 25% after one year and monthly thereafter requires a staggering 37 valuations just for the vesting date valuations (additional valuations are needed on the grant date and as of the fiscal year-end dates). Although we automate these calculations for our clients, there’s still complexity linked to data organization, valuation methodology development, and review.
Modifications. Modifications can fundamentally alter the value of an award. Since CAP measures the value of the awards actually delivered, any additional value gained through modification must be incorporated. Functionally, this means that in the period of modification, the incremental value reported in the new disclosure table will also incorporate the effect of the modification.
Forfeitures. Forfeitures are pretty simple in the sense that they represent a final determination of compensation actually paid equal to $0 on the awards that forfeit. This may take the form of a negative charge to the table, but always remember the rule that the cumulative value recorded across time for an award must equal the value delivered (which for a forfeited award will be $0).
Dividends. Dividends present unique challenges as they represent value being conferred to recipients. When dividends are paid in cash, the value of those cash dividends is added to the table as actual compensation earned. However, when the dividend is issued as additional shares (the common approach for dividend equivalent units), the value of those awards will fluctuate over time. So they’ll need to be tracked the same way that the parent equity awards is tracked.
The release of the final rule touched off a flurry of activity among our clients to dissect and understand the requirements and action steps. Most companies are now working toward a mock disclosure they can take to their compensation committees and senior management. The earlier this occurs, the better so they can create awareness, lock down a calculation methodology, and determine how to approach the discretionary elements of the disclosure. To this end, here’s what you can do now to prepare a high-quality mock disclosure.
Once you’ve completed these steps, you’ll have a completed draft table, a strong and repeatable process, and much better clarity into all the moving parts. Your next move will be to socialize the table and your proposed clear description of the PvP relationship with your internal and external stakeholders, including your compensation committee.
Practically speaking, the final rule asserts that the best measure of CAP is a snapshot of the incremental value progress on all outstanding awards. We showed how newly granted awards build from $0 to their fiscal year end value in the year of grant (unless they vest before then). We also showed how non-newly granted awards track their incremental change in value through the fiscal year end (unless they vest before then).
The new PvP table will be very sensitive to stock price fluctuations. However, don’t expect the tidy directional movements we assumed in our simplified examples. As you layer in multiple overlapping grants, erratic stock price movements, off-cycle grants, various award types, and the other wrinkles we discussed, the movements in table values won’t always be obvious or intuitive. Our preferred scientific term of art is that the PvP relationships may at times become mischievous—perhaps due to underlying PvP problems, but maybe also due to unavoidable variable noise.
Moreover, the composition of the table is bound to be dense and require preplanning and coordination both internally and externally. We’re quickly implementing automated solutions to assist in both the valuation and full table production. Even so, these will require data organization, methodology design, review, and analysis.
As 2023 proxy season races toward us, we recommend rapidly prioritizing efforts to implement mockups so that you can begin discussing the variable relationships, questions like which CSM to use, and how you’ll approach the narrative disclosure. Most compensation committees will expect to see a high-quality mock-up by the December meeting, if not sooner.
If you have any questions related to the new disclosure, or the calculations and topics in this post, please feel free to reach out to us directly.
[1] Remember, in the first year of disclosure, you only need to calculate three years back in time. Then, you’ll add one year in each successive year so that the full five-year table appears in the third year of disclosure.
[2] If you have a pension or non-qualified deferred compensation (NQDC) plan, you’ll also need to pull these respective vendors into the project team.
Download The Article
Pay Versus Performance Is Here, Part 2: Understanding Compensation Actually Paid
