Subscribe to Our Newsletter
Hear more from Equity Methods: Your trusted partner in equity compensation excellence.
Last month, the Wall Street Journal ran a story about how CFOs are cracking down on spreadsheets. “I don’t want financial planning people spending their time importing and exporting and manipulating data,” said one CFO. “I want them to focus on what is the data telling us.”
The article touched a nerve in the finance community. Some stood up for Excel’s power and flexibility. Others pointed out the issues with individual spreadsheet owners, predictive modeling, and more.
I’ll hard pass on generalizing about spreadsheets. But I can tell you this much: When it comes to stock compensation, finance leaders want their teams working on analysis and planning over data grubbing and number crunching.
That’s one of the themes emerging from our 2017 stock compensation accounting best practices survey.
This year’s survey has 207 respondents spanning all industries and company sizes. About 15% represent companies with a market capitalization below $500 million. Another 9% represent companies with market capitalizations of $50 billion and up, and the rest are scattered evenly across the spectrum.
In the survey, we asked a number of questions relevant to the debate about spreadsheets. The trends among them were pretty enlightening. Let’s start with a big one: data analytics.
For example, stakeholders are demanding more forecasting precision and granularity. Close to 80% of the companies in our survey are responding by layering future hypothetical grants into their forecasts. On top of that, nearly all forecast at least one year past the current fiscal year. And re-forecasting (updating a forecast midyear to include new occurrences) is something more than 8 out of 10 organizations do at least once.
Analysis of budget-to-actual variances is important as well, say 94% of respondents. About a third flag it as a basic expectation whether or not the variances are material. This makes sense, since variance analysis is one of the things that gets executives to take stock compensation seriously.
Finance leaders also want to know why period-to-period comparisons differ. This brings flux analyses into the executive compensation picture. Common fluxes involve comparing current-period values to the same period in the prior fiscal year, to the prior period in the current year, and to the prior-period forecast. More important than simply fluxing expense is explaining why the numbers are different—attributing variances to discrete events in the data or plan design so that senior management can get comfortable with the factors at play.
And executives are asking a host of analytical questions, especially before awards are granted. One issue is whether it’s possible to refine an award design so that more equity can be granted at the same cost. Another is the impact that equity has on retention, which may support shrinking the plan and rolling out a different program like an ESPP.
Advanced models like these are something spreadsheets can handle, but not without multiple pivot tables and VLOOKUP functions. The result can be less time to produce insights for senior-level decision-making.
We asked respondents what would occur if a new incentive design were rolled out in the near future. Only 9% said they could easily adapt their processes. By contrast, fully one-third said a new award design would likely require manual processes and workarounds.
And new incentives are something many companies are taking up. In the executive compensation space, for example, multi-metric awards are becoming increasingly popular. These awards usually involve specifying one or two financial metrics, then combining them with a market metric such as total shareholder return (TSR), in which TSR is either a standalone metric or a modifier. Hybrid designs can pose considerable complexity as each metric requires separate handling and a single grant needs to be bifurcated into subcomponents.
Two other trends are worth calling out. One is the reemergence of employee stock purchase plans (ESPPs), especially those with lucrative features that give rise to modification accounting. ESPP accounting introduces a host of complications, and is a prime source of convoluted, manual processes. Another trend is the adoption of international recharge programs. These programs provide tax-free vehicles for repatriating cash to the US and ensuring that tax deductions are captured on awards issued to non-US employees. Recharge arrangements can easily prompt messy spreadsheet processes as they require layering in the effects of employee mobility and specific contractual rules to stock plan data.
None of this is to say spreadsheets can’t handle a new or complicated design. They can, but it takes a long time to retrofit the model, much less to do so in a way that’s repeatable, controlled, and scalable. And even the best models can become so complicated that they become tough to maintain and decode—especially if the people who put them together are no longer around.
To understand why, let’s first consider tax. Earnings and effective tax rate volatility (stemming from ASU 2016-09’s removal of the APIC pool) require tighter connections between tax and general expense reporting. But according to our survey, the team owning expense reporting generally has limited involvement in the tax reporting, as the following table shows.
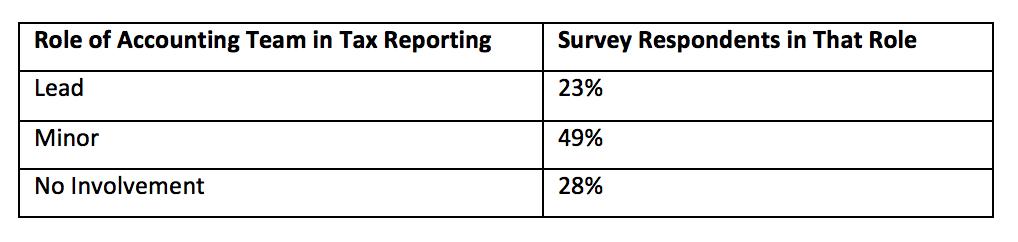
In other words, a handoff occurs between expense reporting and tax 72% of the time. Handoffs are especially hard when the underlying engine is a spreadsheet. Even the best Excel models become “lost in translation” between those who built them and those who use them. Until recently, this didn’t matter so much. But thanks to ASU 2016-09, stock compensation tax accounting now has far greater implications for the financial statement. Potential vulnerabilities include:
To illustrate, consider a company whose DTA fell out of balance because error corrections in the stock plan administration system never pushed through to the tax side. And then there’s the large multinational whose data updates were so frequent that it almost became a control deficiency when post-dated transactions were being missed.
Now let’s look at the compensation landscape, where stock plan data is often a source of disconnect. The reason is that compensation groups want to convey equity awards in the simplest and most intuitive way possible, but that’s not necessarily how accounting needs to report on them. As a result, firms often end up with:
We call these “participant-accounting disconnects.” They’re not always easy to identify. And when they do surface, they often require retrofitting a spreadsheet in order to handle them, which can result in a significant controls issue.
It’s not a matter of whether spreadsheets are appropriate, but whether the alternative is any better. Many organizations have tried off-the-shelf applications only to conclude they might as well use spreadsheets because the application is just too rigid. They still have just as many spreadsheets even though there’s a tool producing the numbers that need to be managed via the spreadsheets.
Instead of banning spreadsheets, consider the business questions you need to answer (i.e., what reports and analytics are needed to satisfy your external reporting obligations and internal management accounting expectations). While you’re at it, think about ways that the finance function might expand its influence beyond compliance. If you’re not getting the analytics you need, they’re too hard to produce, or they’re not having the right impact, then those are the issues you need to address.
