Subscribe to Our Newsletter
Hear more from Equity Methods: Your trusted partner in equity compensation excellence.

The Equity Methods team, September 12, 2018.
Group Five just released its annual industry-standard stock plan financial reporting benchmarking survey. Every year we take stock of the results and take the opportunity to share our thoughts on the most pressing and salient issues we see up ahead in stock-based compensation financial reporting.
*****
“They do a great job! They are incredibly responsive to our inquiries and are more than willing to go the extra mile.”
“Amazing professionals who are incredibly intelligent and always willing to help solve a problem.”
“Fantastic partners! They keep us updated and are always available to work with us on projects and especially during crunch times.”
*****
These are a few of the anonymous pieces of feedback that clients shared. Statements like them mean the world to us, because our reason for existence is to create that impact and value for those we serve.
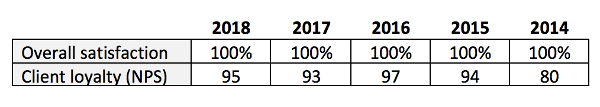
For the fifth consecutive year, Equity Methods leads the industry in client loyalty and overall satisfaction with financial reporting services. Client loyalty is measured using the highly regarded net promoter score (NPS) framework, originally coined by Fred Reichheld of Bain & Co., that asserts the most important measure of loyalty is the answer to just one question: How likely are you to recommend Company X to a friend or colleague? Our NPS was 95 and the industry average was 56. Over the last five years, our client satisfaction and NPS scores have also hovered in this range:
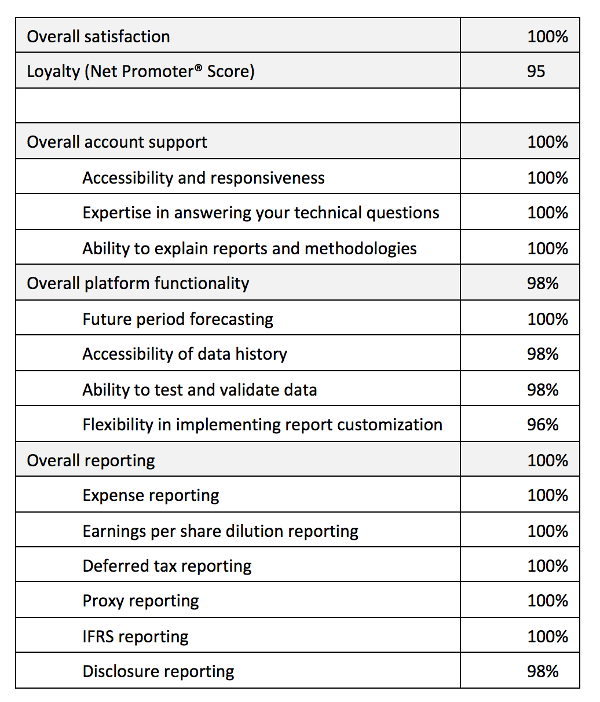
A more detailed breakdown of the 2018 results is:
These results are so meaningful to us because they challenge us to continue making bold strategic investments. We’re exploring entirely new technologies to unlock more speed and flexibility in the reporting we deliver. We made numerous exciting upgrades to our recruiting strategy to ensure we continue hiring top talent. And we continue rolling out new and innovative training tools to help our team grow so they can help our clients in new and more powerful ways.
With our growth (exceeding 70 professionals), we’ve also spent a lot of time making sure our culture and devotion to client service stays fresh. Creating alignment on training, values, and corporate culture has been an ongoing priority, and we’re excited by what this has enabled.
As longtime friends of Equity Methods know, we use the occasion of Group Five’s annual report to reevaluate the state of stock-based compensation. This year has been a busy one. Here’s where we stand today.
Just in time for the new year, President Trump signed the Tax Cuts and Jobs Act (TCJA), which presents the most sweeping changes to the tax code in decades. The immediate result as of early 2018 was a series of deferred tax asset (DTA) true-downs for equity compensation. More recently, the IRS just released Notice 2018-68, which delivers much less flexibility than most expected to see in grandfathering awards under 162(m). This will potentially require more DTA true-downs in the remainder of 2018.
The TCJA also presented a number of lessons to executive compensation leaders. Tax reform created an exogenous shock that shattered many companies’ performance goal levels, prompting either modifications or more flexible grant agreement drafting. And yet too much grant agreement flexibility could preclude an accounting grant date. (We discuss these lessons in our Ethical Boardroom article.)
The full effects of the US Tax Cuts and Jobs Act remain largely unresolved. According to polling results from our June 2018 webcast “Equity Compensation Amid Regulation, Shareholder Activism, and Tax Reform,” most organizations are still reeling from its effects and trying to decide where to make plan design changes.
Companies continue to explore new designs for their long-term incentive awards. Their efforts range from reducing or stabilizing the value of traditional relative TSR (rTSR) awards to developing hybrid awards that enable line of sight for recipients and value for shareholders—even when goals are difficult to forecast. One path to balancing executive incentives with shareholder governance considerations is in the rapidly growing use of multi-metric (“hybrid”) awards.
We expect that award designs will become even more complex. More importantly, this has a couple of implications for finance leaders. One is that reporting processes need to be both automated and ultra-flexible so they can adapt to new designs. This is a hallmark of our service’s bent toward customization. Second, our research finds that best-in-class finance teams contribute to the award design process through analytics, comparative modeling, and illustrating the downstream P&L consequences of new designs.
There’s a clear trend toward senior management expecting more precise forecasts of expense, dilution, and tax benefits. As practitioners, we know firsthand that dozens of moving parts can give rise to a forecasting variance—forfeiture rates, performance multipliers, more/less granting than expected, and so on. The first solution is to develop more robust forecasts that are scenario-based, use bottom-up modeling of future grants, and span multiple years.
But even robust forecasting leaves small variances that finance has to explain. Flux analytics and variance attribution analysis reporting are two ways that leading teams can provide the insight behind the numbers—and as quickly as possible.
This is one reason why we’ve made so many investments in developing flexible and insight-rich forecasting, budgeting, flux analysis, and variance modeling. Some of our clients forecast and explain variances at the business unit level, whereas others stick to a top-of-the-house analysis. Either way, getting these analytics right is tricky because of the number of variables simultaneously influencing the results. Although complicated, we’ve found this is an area where finance teams can really shine and demonstrate impact in their organizations. Stock compensation is all too easily viewed as a black box at the CFO and CAO level, so any effort to demystify the numbers and lend predictive insight is valuable.
Building on my earlier award design points, let’s hone in on total shareholder return (TSR) awards. A majority of companies now have these. Most don’t base the entire award on TSR. Instead, they use it as an independent metric (among others) or as a modifier. TSR awards carry unique risks based on how they’re valued, which is via Monte Carlo simulation. For standard designs, the valuation usually results in a premium over the face value of the stock.
The problem with this premium is that companies set individual grant quantities based on a target value to deliver (e.g., $1.5 million to the CFO). Then they back into the number of units granted either using the Monte Carlo (accounting) value or the face value of the stock.
According to our most recent polling, 61% of companies use the accounting value, which ensures the value disclosed in the proxy matches what the board approved but may create a surprise to the executive recipient. In contrast, using the face value of the stock leads to a more predictable grant quantity to the recipient, but can give rise to a surprise in the proxy that creates a pay-for-performance gap with proxy advisers.
The solution to this dilemma is modeling. For most of our clients, we run multiple models leading up to the grant date. Sometimes this modeling is to tweak and de-risk the design. Other times, the design “is what it is” and the purpose of modeling is to inform management on how the value is trending. In any event, the best practice is to be deeply hands-on during the couple of months leading up to the grant date.
According to our research, over 75% of companies still at least partly rely on spreadsheets. This creates spreadsheet risk, key person dependence risk and, most importantly, takes time away from more valuable activities that involve delivering insight beyond just crunching the numbers.
Must we change this? Aren’t spreadsheet-based processes just a way of life? Maybe. Certainly there’s nothing inherently wrong with spreadsheets—in fact, a few are open on my computer even as I write this. While developing our survey content, I asked my friend, Amit Rai, the former CAO of Laureate Education and CyrusOne, what he thought about the question. His answer is enlightening:
“Excellent stock accounting processes are automated and free of bottlenecks. Ask yourself: How hard is it to change a parameter or assumption, and cascade the new entries through all the financial statements? The more flexible and agile the process, the more it will withstand the complexity equity programs inevitably introduce.”
Certainly every CAO has different priorities and viewpoints. But in most of my conversations, there’s a recurring theme—this idea that complex and core reporting areas need to be “centers of excellence” where the process is clean, automated, and flexible. Turning stock compensation reporting into a center of excellence is an opportunity to create value, show leadership, and help the organization boost its capability for handling tough analytical problems down the road.
Direct tracing—the practice of allocating stock compensation expenses deep within the organization—is fast becoming a standard, especially among large organizations. In our survey, 35% of respondents say they book at the most granular level available (the cost center). By contrast, only 20% put all their expense in a single corporate cost center.
Although direct tracing offers better divisional performance management, it does have its costs. Among them: the need to maintain business unit and cost center information, track employee mobility, and explain cost allocations to skeptical business unit controllers. So direct tracing may not be right for every organization. Even so, we expect its popularity will continue to rise.
The Financial Accounting Standards Board (FASB) tried to simplify the tax accounting for equity compensation via Accounting Standards Update No. 2016-09 (ASU 2016-09). When the new standard was released, we predicted that the effects might instead create more work for tax professionals. Why? Because ASU 2016-09 removed the APIC pool framework, causing all excess tax benefits and deficiencies to flow through the income statement.
This has prompted companies to invest in tax settlement forecasting procedures so they can improve the way they estimate how changes in variables like the stock price or performance outcomes will affect the tax provision and effective tax rate. According to our survey, 61% have implemented such procedures. This percentage jumps to 72% for companies with strong upward reporting and up to 79% for equity granters with more than 1,500 participants.
Three processes in particular remain more manual than they need to be, and all relate to international equity reporting. One is recharging the cost of equity awards granted to employees in foreign jurisdictions. The second involves employee mobility, where companies must allocate deductions based on where services were rendered; only 46% of respondents say they’re able to do this. And the final process? Statutory reporting according to International Financial Reporting Standard (IFRS) 2 or local accounting standards. The problem here is that local entity controllers may lack the technical expertise to perform the accounting correctly—and, in any case, don’t have the data access to carry it out as effectively as they might.
If you have a large international equity population, take a look at these processes to make sure they’re tightly controlled.
Many thanks as always to our clients who so generously gave their time to Group Five’s benchmarking effort. We greatly appreciate the feedback.
Request a complimentary copy of the summary benchmark report from Group Five.
Visit the knowledge center for more on the above topics.
Tell us about any other topics you’d like to see us cover.
