Subscribe to Our Newsletter
Hear more from Equity Methods: Your trusted partner in equity compensation excellence.
Traditionally, we think of pay inequity (gender- or ethnicity-linked) as stemming from factors like unconscious bias or differential negotiation frameworks. What the recent labor market volatility has shown is that pay inequity can even arise from hiring and quitting imbalances.
The Great Resignation sent a shockwave through many sectors of the economy. During this time, the rate of employees voluntarily leaving their jobs almost doubled to a 20-year high of 3% in 2021. Meanwhile, the unemployment rate fell as low as 3.6%. While it’s no surprise that pay compression and pay inversion materialized during this unprecedented period, it may come as a surprise that many companies experienced a substantial deterioration in pay equity—despite maintaining robust fair pay policies throughout.
Here, we’ll discuss how basic imbalances in hiring (e.g., hiring more males or more white people) during volatile periods in the labor market can mechanically introduce pay equity gaps. We’ll discuss how these new types of gaps can emerge, how to assess and remediate them, and implications for maintaining a robust pay equity monitoring program during changing economic conditions.
It’s important to note that the labor market isn’t a simple Economics 101 supply-and-demand problem. Factors like in-demand skills, negotiation ability, and just being in the right place at the right time can have a significant impact on pay. You can hire a cohort consisting of different genders or different ethnicities at the same rate of pay (who are doing the same job) and introduce disruption based on how the joiners interact with the existing population. Differential quit rates can have the same redistributive effects.
The labor shortage and complexity of 2021 amounted to a surge in the competition for labor, thereby driving up starting salaries for new hires, and often at rates exceeding those for existing employees. Of course, what goes up must come down. More recently,
the labor market has cooled, and starting wages have fallen towards earlier levels. Many companies now have significant pay differentials between employees performing similar work, not because of traditional factors like skill or experience, but rather, when they were hired.
When we look at reasonable determinants of pay within a pay equity study, we would expect that more experience should result in higher wages. Someone with eight years at the company performing Job A should make more than someone with one year at the company who is also performing Job A. But the opposite transpired during the Great Resignation. Employees were receiving multiple offer letters and companies were much more focused on speed to hire than hitting target experience levels for their open requisitions. As a result, pay compression or even pay inversion arose (Figure 1).
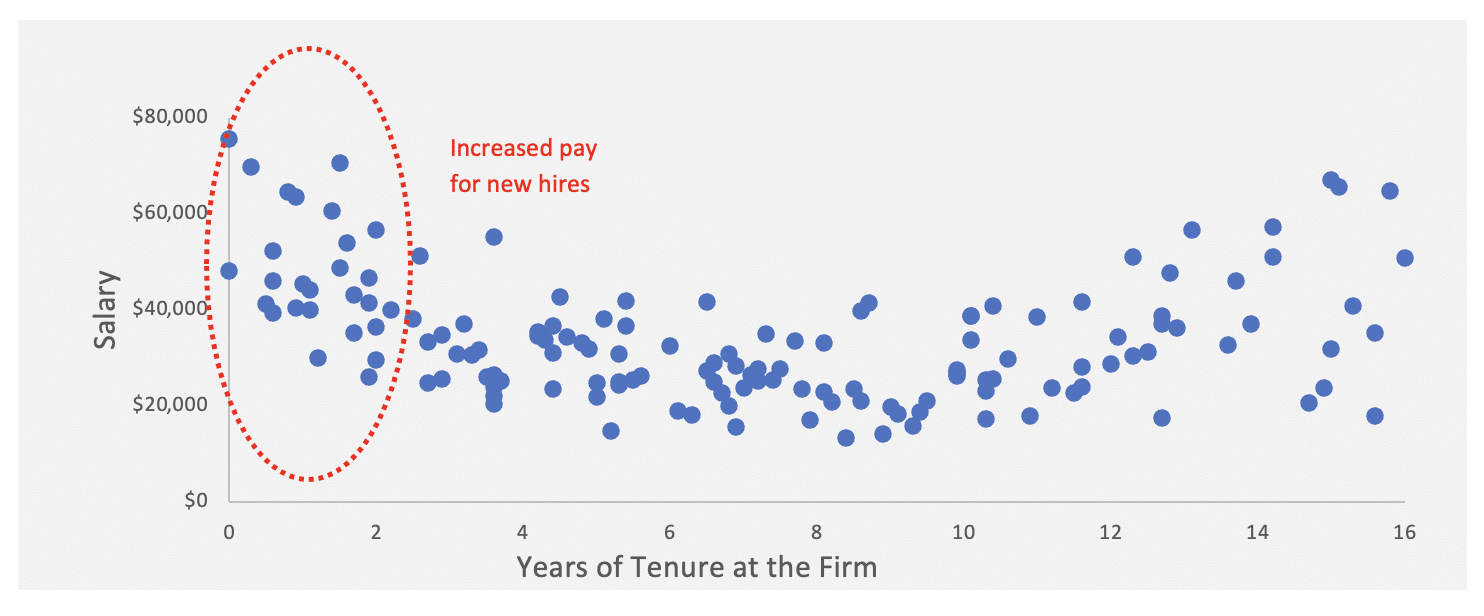
Figure 1: Pay Inversion Example
These phenomena highlight both the importance of breaking down employees into different cohorts for individual treatment and analysis, as well as using appropriate qualitative and quantitative techniques to find appropriate groupings. In our pay equity practice, we’ve seen the need for wholesale methodology changes to better capture the dynamics that unfolded during the Great Resignation. More on this in a moment.
Of course, boom markets eventually slow, and the customary relationships between tenure, experience, and pay return. Even so, the employee census isn’t the same as it was previously and it will likely take years for the effects of the boom to work their way through the system.
Changing labor markets can both mask and introduce pay equity problems. This is true even if salaries are kept positively uniform between genders and ethnicities. Here, the cause isn’t disparate treatment, but rather, the mechanical effect that pay compression and pay inversion have across employee cohorts with different gender or race compositions.
Consider a scenario where a company is 50% male and 50% female. Then comes the Great Resignation when employee bargaining power increases, and for the next two years the company hires 66% males and 33% females. After that, circumstances return to normal. During the boom years, there was a 30% new hire salary premium that subsequently fell to 10%. Even considering tenure in a simple pay equity regression model, we can see how changes in the gender balance of new hires coupled with starting salary inflation mechanically introduces pay inequity (even though there was no pay differentiation within the cohort). Figure 2 illustrates the basic math behind this phenomenon.
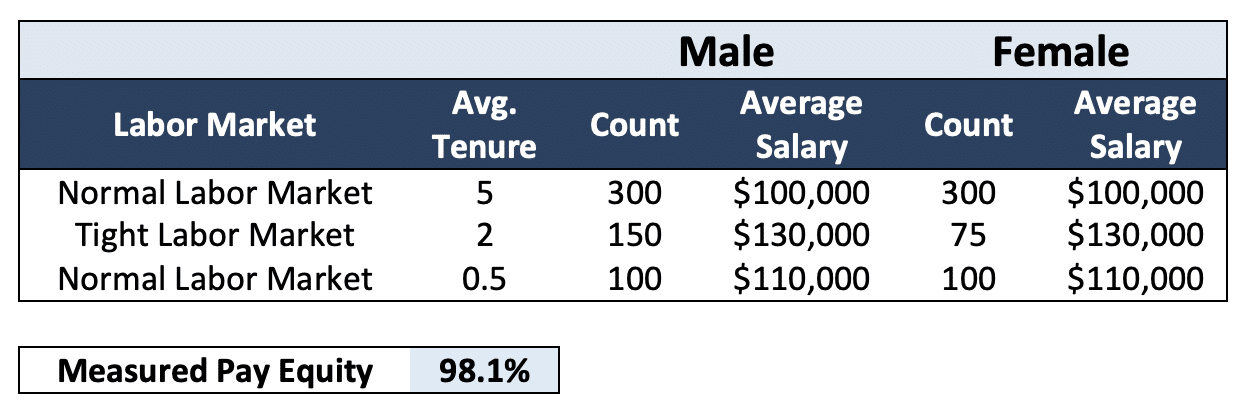
Figure 2: Example of Pay Equity Favoring Males
Notice that while there was perfect pay parity between males and females during each period, the compositional differences caused an overall pay inequity against females. Factoring in company tenure doesn’t make this problem go away since the relationship between tenure and pay has dampened. Deeper investigations and cohort considerations are required to get to the answer.
Before delving into more granular cohort analysis, you might be wondering: so what? If a pay equity gap emerges due to new cohorts having intra-cohort pay equity but redistributing the broader pond in a way that creates pay inequity, is it really a problem? Legally, probably not. That’s because (implicitly) the company’s compensation philosophy deprioritized tenure and chose to pay a market premium that wasn’t linked to gender or ethnicity. But if the company wishes to reinvigorate the role of experience in its pay philosophy, remediation may be required to bring pay relationships back into their proper balance.
Furthermore, robotically using prior pay equity models could misdiagnose the situation as involving deteriorating pay equity due to discriminatory practices when, in fact, it’s something much different. From a litigation perspective, this is problematic.
As mentioned, we’ve substantially changed our approach to pay equity analysis in light of these mechanical effects that arose during the Great Resignation. Our clients have been looking into:
This is why pay equity studies can never be rote push-button exercises.
Using the basic fact pattern in Figure 2, we need to structure the study to ensure we’re measuring all the moving pieces effectively. Consider, for example, two seemingly reasonable tests of pay equity based on Figure 2:
In typical studies, we test for the impact of experience and we think about the experience variable in the model as having a generally increasing relationship with pay. But the Great Resignation shattered this. Now, we often need a more nuanced variable that categorizes employees into different experience groups based on how pay structures changed. We refer to this as a time-based or time-of-hire-based cohort analysis because we’re still using experience, just in a more refined capacity.
Said differently, in-depth cohort analysis simply means to observe and understand which cohorts may have higher or lower pay. In Figure 2, you can see we needed to form three cohorts to reflect the before, during, and after groups (vis-à-vis the Great Resignation). In reality, we may need more groups based on how salaries were adjusted and the interaction between time of hire and role. Time of hire may vary based on department, office location, or any other factor that can cause pay differences more broadly.[1]
Defining appropriate cohorts based on a company’s employee population and adjusting for cohort-level differences are nontrivial exercises. No two cases are the same. The definition of a cohort depends on your own hiring patterns, the frequency and magnitude of salary changes over time, and the interaction with other relevant variables.
We approach in-depth cohort analysis in our projects by studying the data to derive a picture of cohort variation in the data. One way to do this is to look for large numbers of similarly situated employees whose pay predicted by the model doesn’t match their actual pay—what we often call outliers. An outlier threshold of 5% is common.
If a particular group has people that are more likely to fall outside the predicted range, both above and below the forecast, the group has more pay variability than the rest of the population.[2] Alternatively, if more than the expected amount are either above or below, but not both, this is a sign of a cohort whose pay is not captured well by the model. For example, in an affected cohort, you might see upward of 30% of employees with pay significantly below expectations.[3]
Searching for affected cohorts has to be done strategically. Changes in any labor market condition, or between any groups, can affect these observations. We’ve found that a combination of data analysis, company knowledge, and visualization is how you identify, understand, and address cohort-based issues.
What if a pay equity gap did emerge but solely due to time-of-hire cohort differences? The compensation committee should know this and not erroneously conclude that the organization’s pay equity efforts are failing. Instead, management and the compensation committee should focus on whether to restore the traditional relationship between experience and pay (and if so, how to phase that in over time).
No company explicitly sets out to pay females less than males or minorities less than white employees. With that said, a lot of drivers can cause inequalities to appear in the data. Some reflect major problems in the execution of the pay strategy and require remediation, whereas others may be explainable by more benign or acceptable factors.
For many companies, the turbulence in the labor market led to pay inversion and other shocks to the rewards framework, thereby giving rise to new types of pay differences and potential problems. In-depth cohort analysis identifies these problems and separates them from other factors behind a pay equity gap. As such, the type of remediation needed (if any) varies based on the nature of the issue.
Only through rigorous data and root cause analysis are these nuances appropriately identified and put into context. An annual process of carefully testing pay equity—and, specifically, looking at changes from the prior period—is a key best practice for total rewards leaders. Finally, total rewards leaders will be expected to package these incredibly complex and technical insights for their senior management and compensation committees. This way, the broader stakeholder group can understand not only the outputs but the drivers and implications for forward-looking compensation decisions.
****************************************************
[1] It’s important to note that not all cohort differences are an equity issue. If the company has more men than women in San Francisco than Reno, it’s very reasonable to expect the average male will be paid more. In this case, we’ll look at the cohorts to determine appropriate controls for our study.
[2] The statistical term for this is heteroscedasticity if you want to bore people at parties with your wonky knowledge. We commonly illustrate this by regressing animal brain sizes on animal weights. Consider an elephant and a mouse. You may find the prediction error for an elephant’s brain size is substantially larger than a whole mouse. There are many ways to adjust for this depending on your data. In our animal example, we move to a regression where it is based on percentage changes to both sides, which is similar to our work in pay equity.
[3] In the same terms of our brain/body regression, we might find that mammals tend to have larger brains than predicted by their size. A statistical fix is to add an indicator variable that tells the regression: “If the animal is a mammal, expect the brain to be bigger by x amount.”
