Subscribe to Our Newsletter
Hear more from Equity Methods: Your trusted partner in equity compensation excellence.
I spend a lot of time on the road these days, visiting clients and delivering talks. And lately, everywhere I go, a subject that keeps coming up is the current status of relative total shareholder return (rTSR) designs and how they appear to internal and external constituencies. Six presentations and at least fifty conversations later, I still don’t think there are any easy answers.
One of those talks I mentioned—with John Roe, the managing director of ISS Analytics—was particularly enjoyable and illuminating. Here are some of the key takeaways:
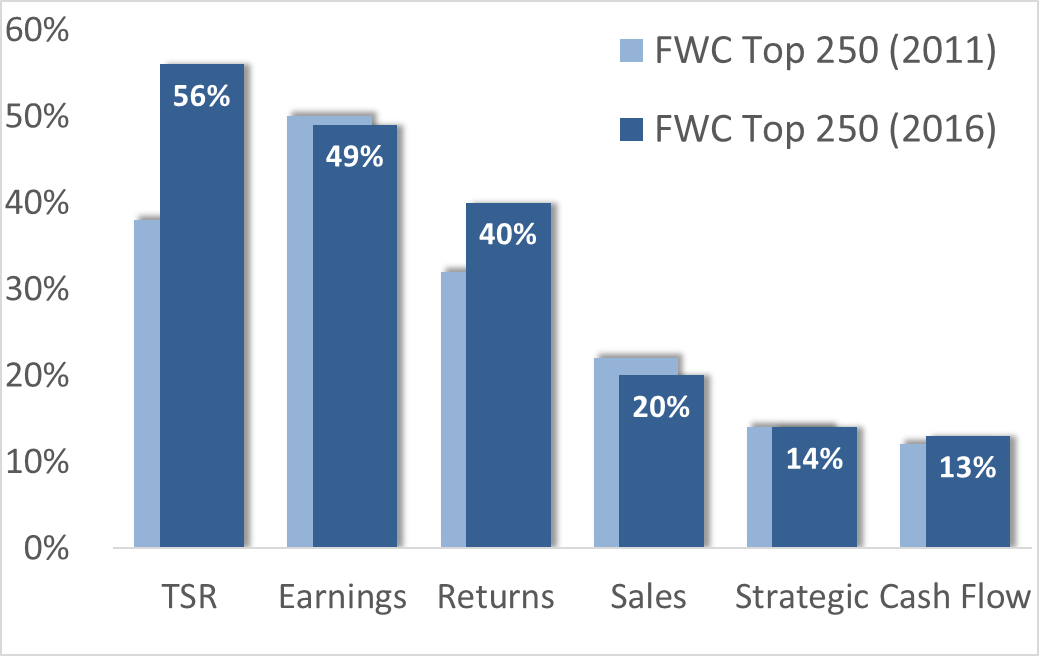
According to data from ISS, FW Cook, Equilar, and others, just over 50% of companies use TSR designs. FW Cook’s 2016 Top 250 Report shows a healthy five-year uptick in TSR:
Line of sight is the most commonly identified problem, but it’s hardly the only one. TSR payouts are very sensitive to start and end dates, peer groups can introduce noise, and excessive focus on shareholder return can obfuscate key business goals and metrics.
Yes, generalizations are dangerous. But TSR isn’t so bulletproof that it can or should stand on its own.
John says that this point often surprises people. A prevailing urban legend is that ISS wants to see TSR, and that’s simply not the case. Here’s John’s slide on the topic:
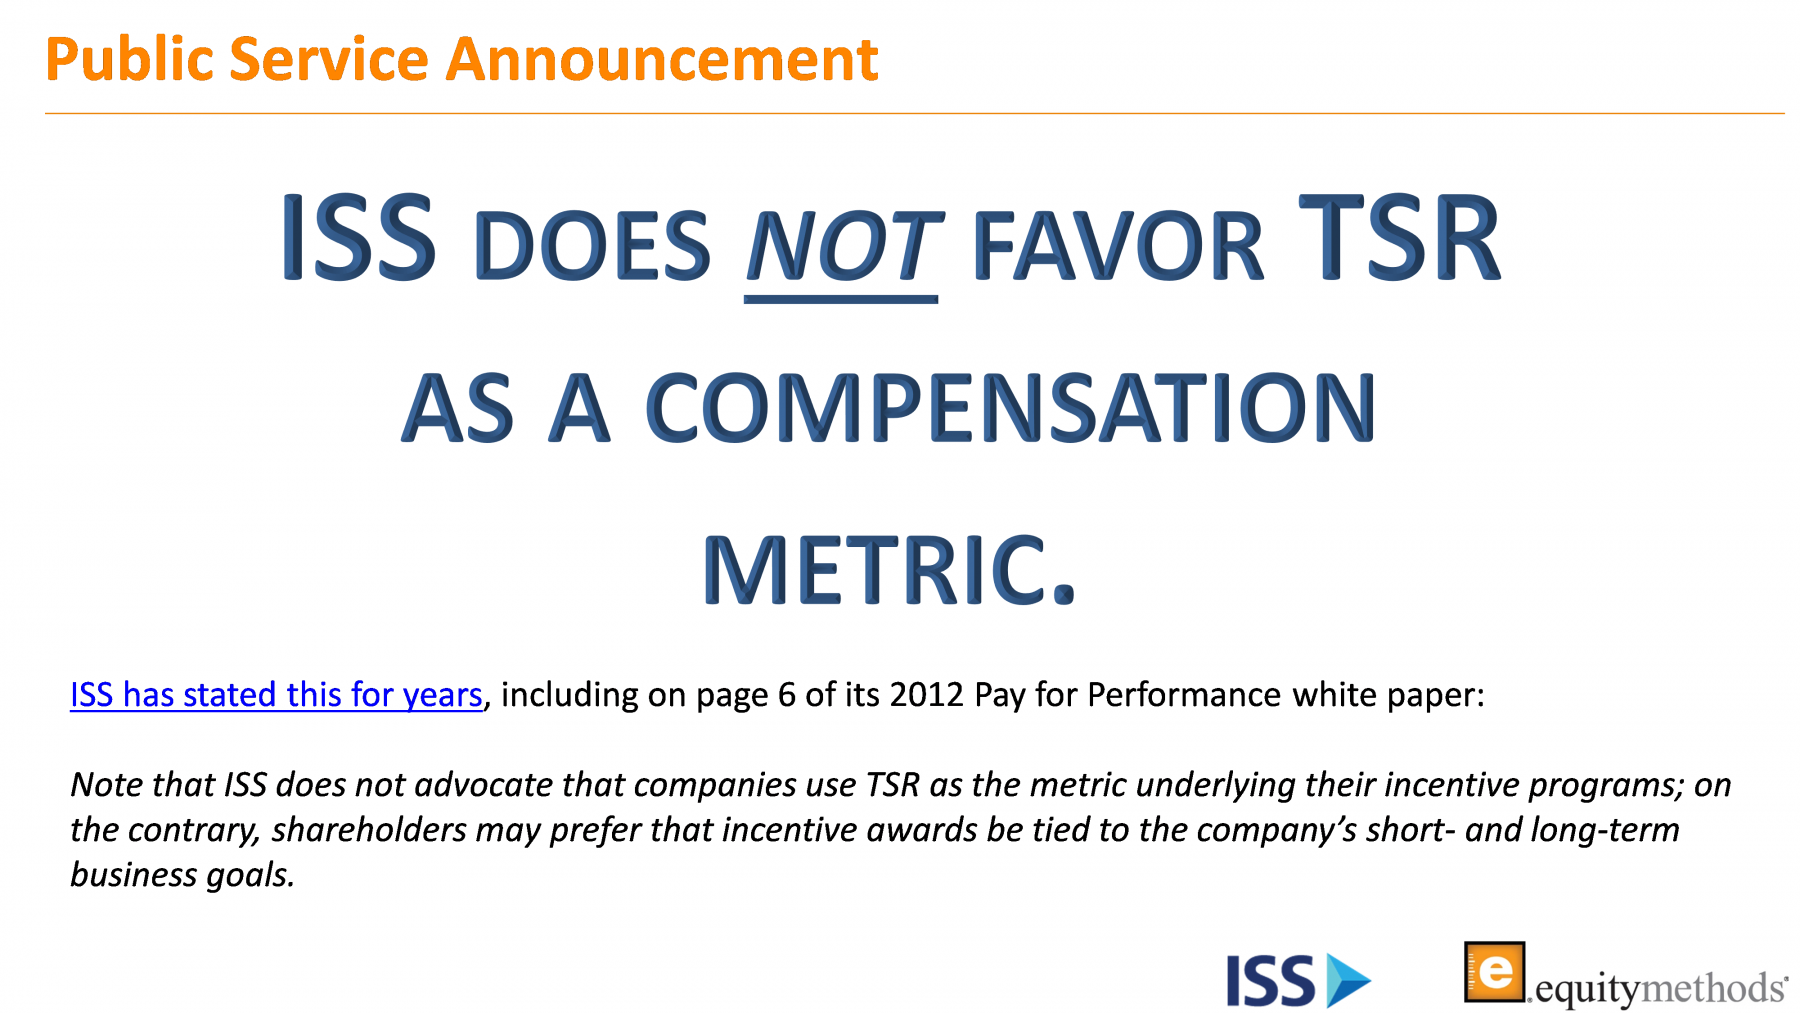
Is a series of one-year metrics preferable? No. As we’ll explain in a bit, ISS wants to see long-term metrics (meaning three-plus years). They also want to see evidence of rigorous goals.
One is that goal-setting is simpler, since TSR is usually structured on a relative basis. Hard as it is to pick a reliable comparison group, it’s still often easier than setting threshold, target, and stretch goals far into the future with macroeconomic uncertainties hanging in the balance.
Arguably the most important facet of TSR is its contribution to a good realizable pay story. When TSR is down, there needs to be a mechanical effect in the long-term incentive pay (LTIP) design that ratchets down pay. When TSR is up, pay should also be up. Financial and operational metrics don’t consistently deliver this. That’s partly due to goal-setting difficulties and partly because few metrics are so all-inclusive that they highly correlate with TSR.
As you probably know, the quantitative relative degree of alignment (RDA) test that ISS uses compares a company’s relative pay ranking with its rTSR ranking. Ranking disconnects may set the stage for an “against” vote. That said, investors would like ISS to use metrics other than TSR in their quantitative screening.
How does ISS know? They survey institutions every year. One question they ask is, “Would you or your organization generally support the incorporation of other financial metric(s) in addition to TSR into the ISS P4P quantitative screens as a better way to identify potential pay-for-performance misalignment?”
Here‘s the latest response to that question:
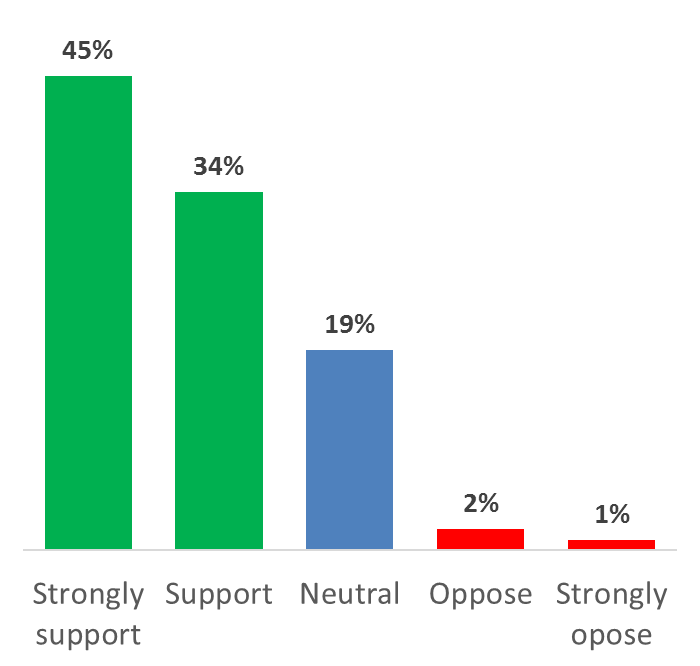
None of this suggests that investors aren’t interested in TSR. But investors would like more cuts of the data so they can see a panoramic view of alternative performance metrics vis-à-vis pay changes. This survey data suggests there’s support for ISS to use other measures of performance besides rTSR in their quantitative screening.
ISS asked what other metrics investors would like to see. Here’s what investors said:

Return on invested capital (ROIC), similar to its cousins return on equity (ROE) and return on assets (ROA), tries to capture how effectively executives act as stewards of the capital they’re beholden to.
A basic tenet of finance is that investors expect a particular return on their capital. If that return isn’t there, managers should return the capital to shareholders. Shareholders base the expected return on the riskiness (and other factors) of the stock. That’s why the expected return on IBM is lower than on Snap Inc.
For this reason, ROIC is preferable to ROE or ROA. ROE rewards firms with high debt, and ROA can be noisy (especially in financial services firms).
Watch carefully. Entirely new ways of measuring pay and performance may be on the horizon, and there’s a good chance that TSR will not be the only lens through which firm performance is graded.
TSR is easy to pick on. But at Equity Methods, we worry that alternative performance metrics like ROIC introduce an entirely new set of problems. First, it’s unclear whether it should be measured on a relative or absolute basis. Each approach has its problems.
Measuring ROIC on a relative basis introduces far worse noise than TSR awards. That’s because different risk profiles, accounting conventions, and sub-industry differences can skew the comparisons.
On the other hand, measuring ROIC on an absolute basis might set very strange expectations. What does good ROIC performance look like, anyway? Mature companies probably can’t increase their ROIC much. The best way for a mature company to improve ROIC would be to harvest its assets, but that could forfeit the long run for the short run. As for newly public companies, they may need to sacrifice income statement returns as they invest in anticipation of future growth.
We’re very suspicious of any one-size-fits-all way to grade year-over-year ROIC results.
A benefit of multi-metric designs is that they acknowledge different constituencies are affected by long-term incentive design, and each has different concerns and objectives. LTIPs need to drive line of sight with executives while yielding tight pay-for-performance sensitivity. Metrics need to capture essential financial or operational imperatives while linking back to shareholder value creation.
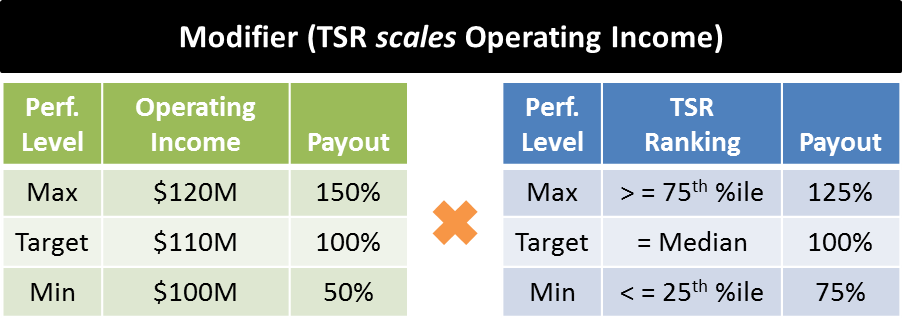
We’ve written extensively on multi-metric (“hybrid”) awards and their attendant benefits. Multiple metrics can be stacked alongside one another independently, such that the outcome of one doesn’t impact another. This is called an “additive” design. Alternatively, a modifier design sets one metric (often rTSR) to modify the payout of one or more other metrics. For example:
FW Cook’s 2016 Top 250 Report shows a decline in solo-metric designs and an uptick in multi-metric designs:
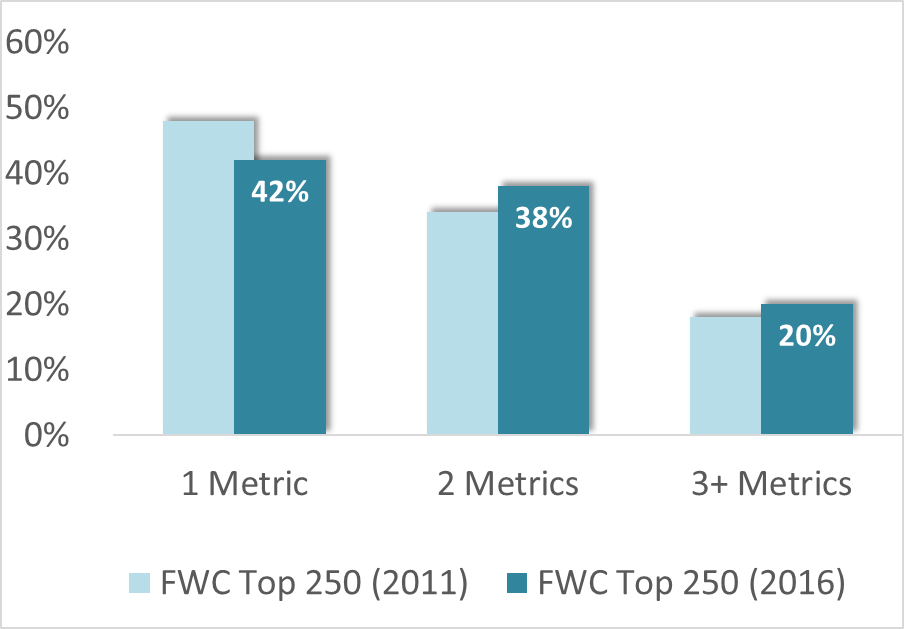
Why? Activist investors are one reason. Another is that even long-run and passive investors are becoming more interested in understanding the logic behind compensation decisions and how the long-term incentive plan supports good governance. Finally, there’s the possibility that pay-for-performance testing will end up encompassing non-TSR metrics, which will only complicate matters further.
We predict state-of-the-art proxies will soon accomplish the following:
According to our research, approximately 25% of companies disclose some form of alternative pay metric beyond what is mandated in the summary compensation table. Realizable pay and realized pay are two of the most common metrics.
What’s not widely understood is that there’s no static definition of realizable and realized pay. Neither are there singular ways of visualizing these metrics. We’ve seen no fewer than 10 different ways to calculate and present these metrics. What’s more, we’ve seen some visualizations collapse simply based on how time periods are matched to grant cycles.
Even worse, we see that adoption of these metrics is often crisis-borne. That is, the metric is quickly slapped together during a low-performance year when the say-on-pay vote hangs in jeopardy. For this reason, we encourage companies to:
We’ve all heard it countless times before, but it still bears repeating: One size doesn’t fit all.
There’s unfortunately no silver bullet award design that addresses the concerns of recipients, the compensation committee, and shareholders. Even shareholders aren’t a homogenous group. They have varying voting policies and apply proxy advisors’ insights to different degrees.
As executive compensation professionals, we need to craft solutions that fit the context at hand. Fortunately, techniques for evaluating pay and performance are evolving and becoming more nuanced, and the door is wide open for custom, unique pay programs. Executive pay that’s thoughtfully designed and disclosed can give a positive outcome for both the company and shareholders.
Don’t miss another topic! Get insights about HR advisory, financial reporting, and valuation directly via email:
subscribe