Subscribe to Our Newsletter
Hear more from Equity Methods: Your trusted partner in equity compensation excellence.
For private and newly public companies who grant options, it’s hard to develop an appropriate volatility assumption. Without historical trading data or market traded options, they have to develop an assumption from scratch. Companies who recently emerged from bankruptcy, revamped their company structure, or saw other significant changes find themselves in a similar position. All must turn to leverage adjusted peer volatility to get a better estimate of volatility they can use in fair value calculations.
Due to their inherent diversification, ASC 718-10-55-25 discourages the use of broad or even sector indices as a peer group for volatility purposes. That makes it critical to select a relevant set of peer companies. In this article, we’ll discuss four key criteria for determining a comprehensive peer group: company size, lifecycle stage, industry, and capital structure. We’ll wrap with a brief discussion of other factors to consider when developing a leverage adjusted peer volatility methodology.
To make sure peers are roughly the same size, focus on market cap. Small cap companies tend to have higher volatility than large caps (Figure 1), so it doesn’t make a ton of sense to compare (for example) a small software startup to a global technology company like Microsoft.
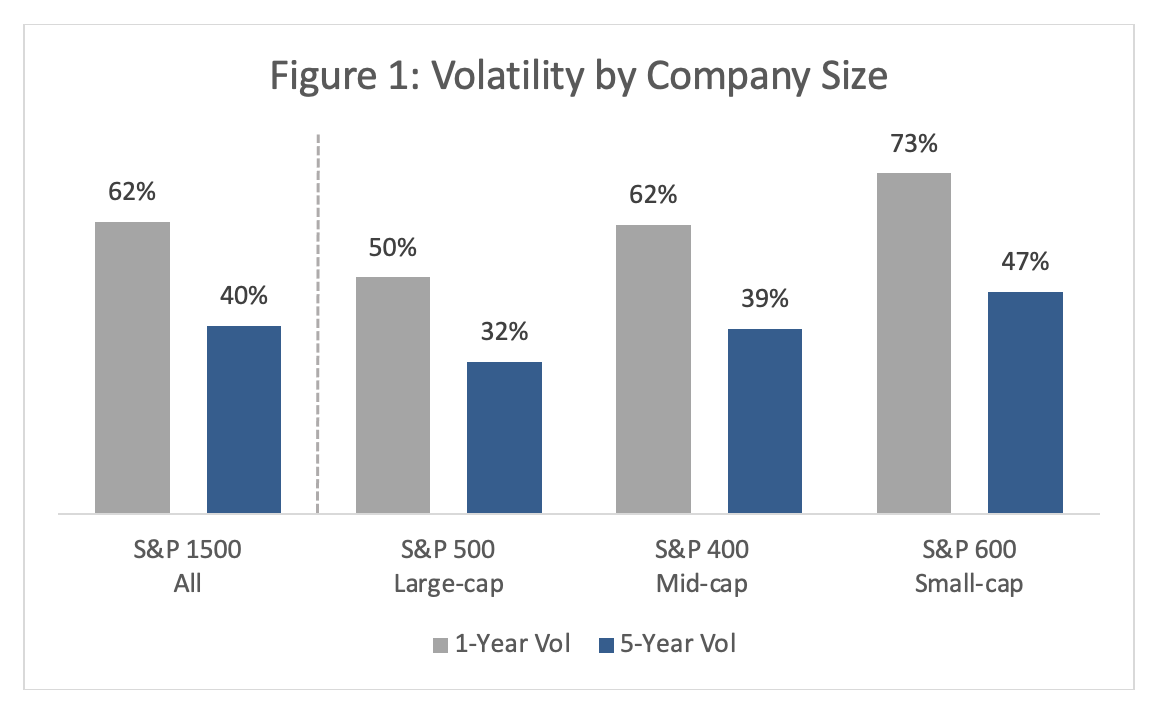
Each of the following graphs shows one and five-year volatilities. This is to illustrate the effects more volatile periods, such as the Covid-19 pandemic, have on each subset as well as a more representative picture of market volatility.
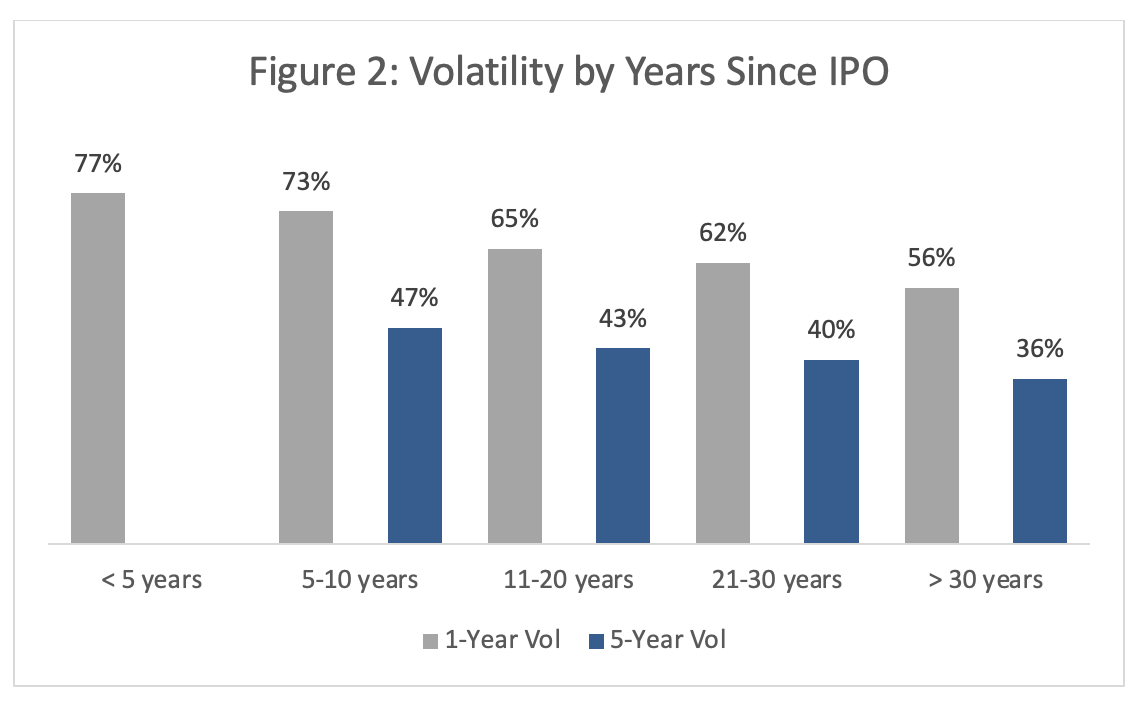
It’s important to have peers that are close to the same life stage because volatility tends to go down with maturity (Figure 2). While many startups may not find companies as early stage as they are, a volatility assumption based on peers that are much more mature is not going to yield an estimate that’s accurate enough for fair value calculations.
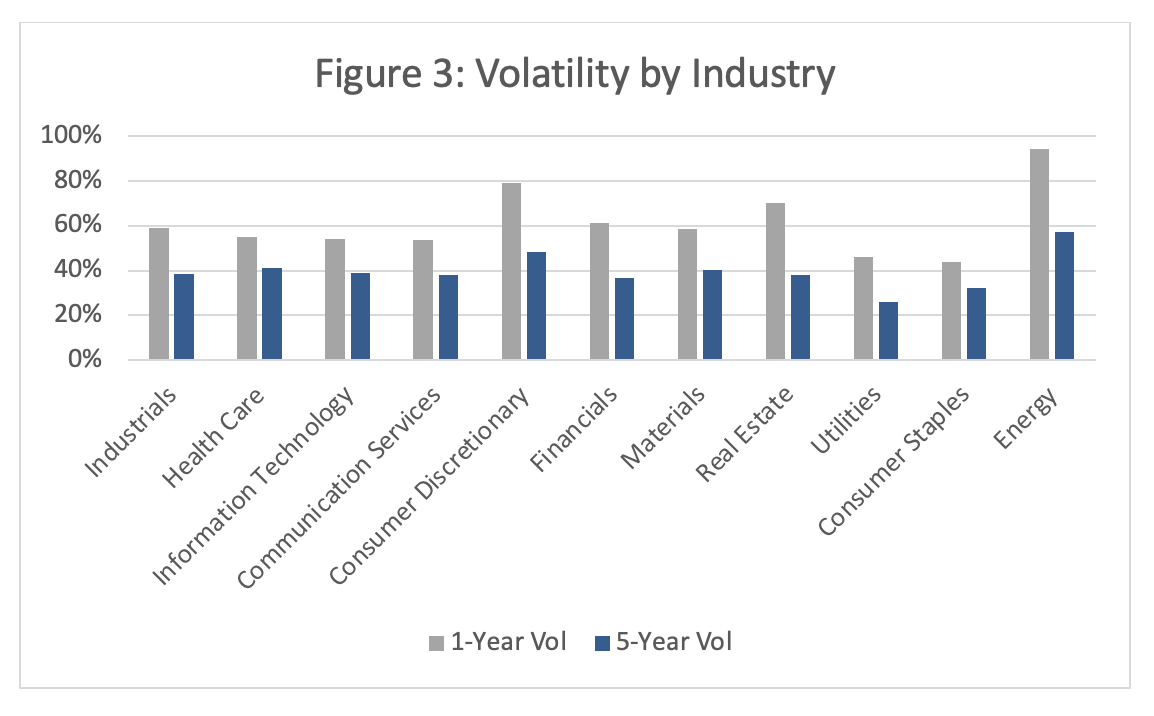
For a volatility peer group, aim for companies that are in the same industry. Companies within sectors tend to have similar risk exposures and therefore volatilities. For example, utilities have relatively stable revenues compared with the consumer discretionary sector, which is heavily driven by the broader economy (Figure 3).
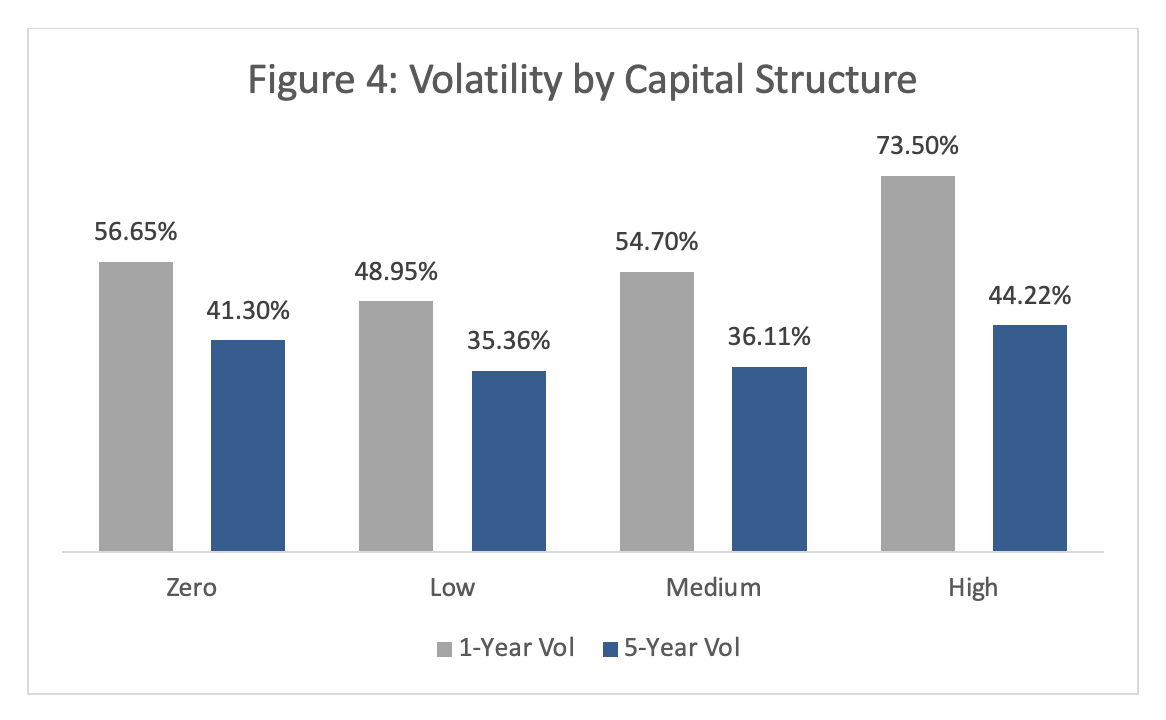
There are many ways to gauge the capital structure of a company, but we use the long-term debt to equity ratio. Generally speaking, the more debt a company has, the more volatile the stock price will be (Figure 4). So peers with similar debt ratios will yield a more accurate volatility estimate. (One caveat: Companies with no long-term debt tend to be newer and thus more volatile.)
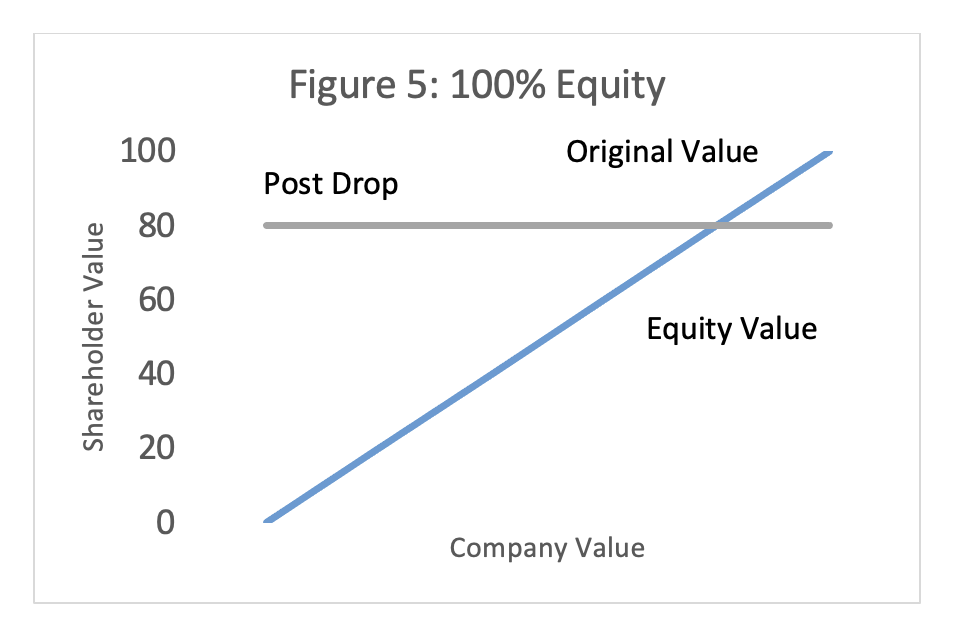
Another way to think about capital structure is to gauge how changes in a company’s overall value impacts the equity. Imagine a company that has no debt and is worth $100. A 20% decline in the value of the company results in a 20% loss in equity (Figure 5).
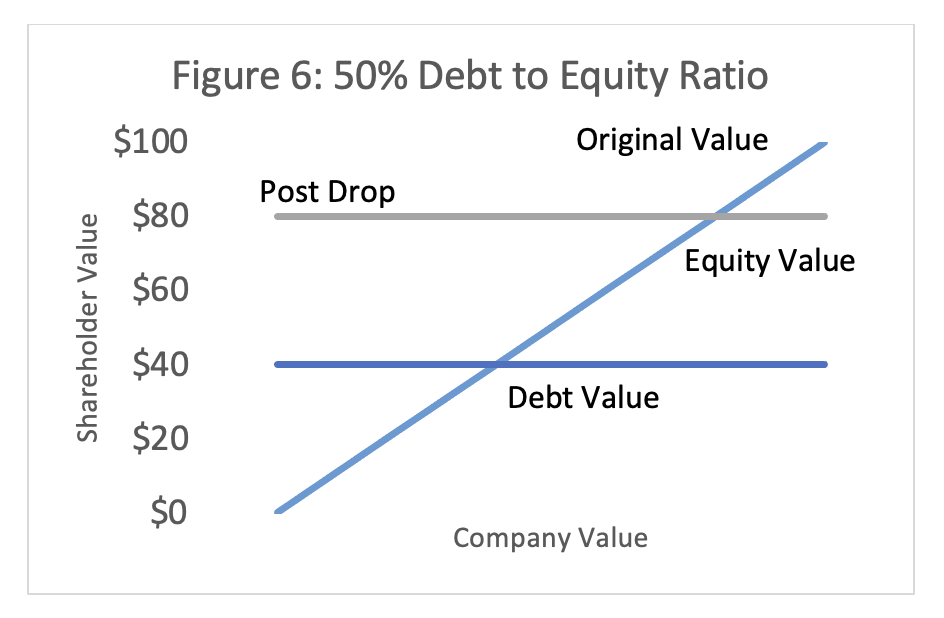
However, if the company has a 50/50 debt to equity ratio, that same 20% decline in value results in a 40% loss in the equity value—assuming the debt value stays constant at $50 (Figure 6).
Leverage does vary from the other three factors in a significant manner. While size, stage of business, and industry are immutable characteristics of a company at a given time, a company can issue or pay down debt in order to change its capital structure and, as a result, its equity volatility. A key concept here is that we can independently consider the impact of leverage with a mathematical adjustment. The AICPA’s Valuation of Privately-Held-Company Equity Securities Issued as Compensation lays out the steps in adjusting for leveraged volatility:
Note that leverage adjusting a peer’s volatility alone does not make it a good fit. It’s important to account for the other criteria first, then use leverage adjustment to smooth out any bumps that a difference in capital structure causes.
In addition, peers should meet the above criteria as closely as possible for the volatility estimate. There may be dozens of qualified options, and that’s where this process veers between science and art. As long as any prospective peer reasonably fits into the framework, it’s up to management to include it or not. However, some leeway is available if a given company is in a newer or small industry such as electric vehicles. It may be difficult to find enough suitable peers that meet the framework, so companies are allowed to expand the guidelines as needed. This might include opening up the search from, say, strictly electric vehicle manufacturers to automotive component or diversified vehicle manufacturers.
A common question is what the right number of peers is. The answer is that it depends, as there are tradeoffs involved. If a company chooses to go with fewer peers that are all a great fit, then they run into an issue if any of them is acquired or goes bankrupt. On the flip side, if the company chooses to include a larger number of peers, they run the risk of some not being a very good fit and thus not producing an accurate volatility estimate. We typically recommend a peer group of four to six companies, but may recommend more or fewer depending on the fact pattern.
One thing the guidance doesn’t specifically point out, but should be considered, is the stability of the peer companies relative to the target company. Historical price volatility doesn’t always capture this. Special consideration should be given to make sure companies don’t have extended periods of different volatility from the rest of the peers due to specific events.
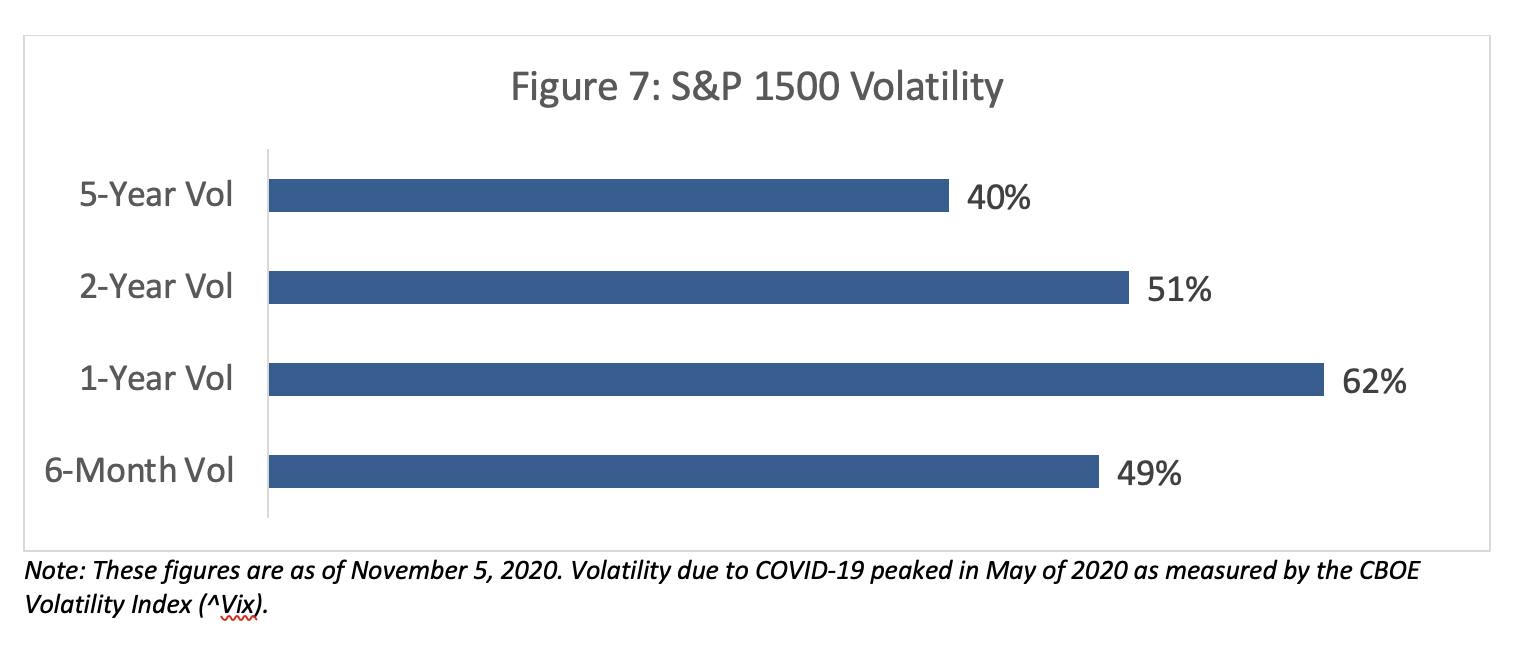
It’s also worth considering whether the methodology reflects a time of extraordinary volatility in the broader market. (For example, Figure 7 shows the effect that the COVID-19 pandemic had on the S&P 1500.) If so, the company should look at different terms of historical volatility to make sure there are no unexpected volatility outliers among the peers.
Finally, what happens if one peer’s volatility is completely different from the others? The guidance does allow for periodic testing and, if needed, updates to a company’s peer volatility methodology. If a peer no longer meets the above criteria, they can be replaced with a better match. Keep in mind that auditors may ask about any changes, so make sure the case for making them is supportable.
Questions? Please consider us a resource. You can contact us anytime.
[1] For technically oriented readers, an average is typically calculated on the squared volatilities, with the reason being that variance, the squared volatility, operates linearly where standard deviation does not.
