Subscribe to Our Newsletter
Hear more from Equity Methods: Your trusted partner in equity compensation excellence.
Total shareholder return (TSR) continues to be the most widely used performance metric in the market. As of last year’s proxy season, 60% of companies that granted performance stock units used TSR as a metric. We expect to see an uptick this year as more companies added relative TSR to dampen the uncertainty of their absolute financial metrics.
TSR awards are popular because they provide a strong and objective link between executive pay and company performance. They tie directly to shareholder value creation and, if used as a relative metric, make it easier to set goals compared with a three-year financial metric.
There are also cons to TSR. Executives tend to feel like they can control financial metric outcomes more than the stock price, a company’s strategy will encompass many metrics, and the fair value can be highly volatile each year if the award isn’t designed a certain way. This volatility can lead to high fair values and therefore either higher-than-expected expense or lower-than-expected grant sizes. When this happens, our clients often ask us, “Why is the fair value so high?”
This was a very common question from our clients in the 2021 granting season. The most common reasons were:
In this blog post, we’ll walk through some case studies that illustrate these core issues, along with award design changes that can mitigate the resulting spikes going forward.
The largest driver of TSR fair value is what we call realized performance. This is the TSR performance of you and your peer group between the start of the performance period (often the first day of the fiscal year) and the grant date (often one to three months later). As the duration between these two dates increases, the potential range of fair value also widens, therefore increasing the likelihood of a high fair value.
The illustration below shows this in action. As of the grant date, each company in the peer group has a “realized TSR,” which is the return that’s calculated using the grant-date stock price and the beginning TSR price. The beginning TSR price is often defined as the average over a certain number of trading days leading up to the start of the performance period. As noted above, that’s often many months before the grant date. This gap between dates creates a distribution of returns in the peer group.
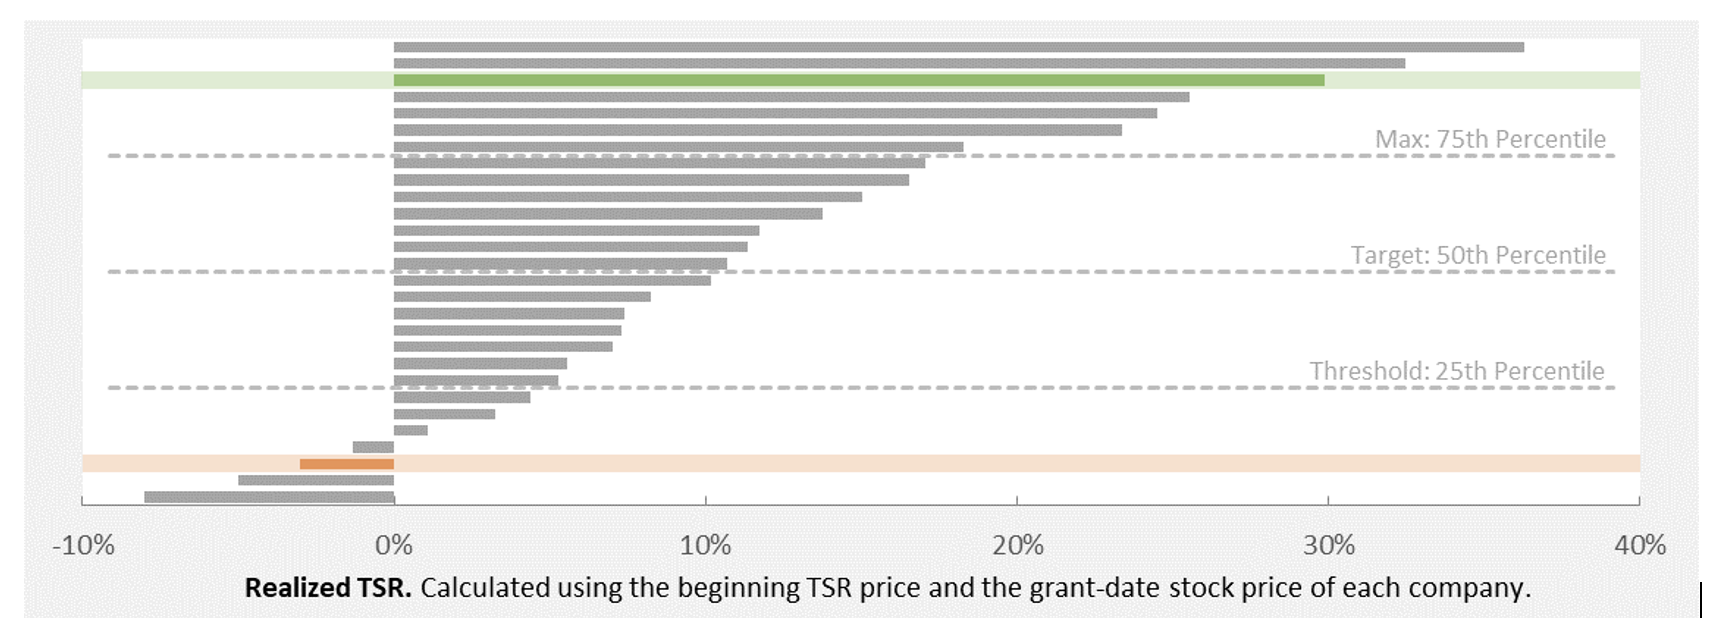
There are two companies highlighted in this illustration. The first is in green. This company is ranked toward the top of the peer group as of the grant date, which would result in a higher-than-normal fair value. The inverse is true for the company in orange. The orange company’s near-bottom ranking would result in a lower-than-normal fair value. In practice, many companies see a variety of rankings over the years, which is usually the main driver behind their fair value fluctuations from one year to the next.
Most TSR granters are susceptible to realized performance given that most align the TSR performance period with the fiscal year. For those with a modifier design involving financial metrics and a lower weight on TSR, this timing makes perfect sense—the timing aligns across metrics and the fair value swings are mitigated by the lower weighting. For companies with a higher weight on TSR, we often see this as the default approach until a severe swing makes them rethink the design. The case that we’re about to highlight is a perfect example.
Last year, this company granted a TSR award and ranked at the bottom of the peer group as of the grant date (similar to the orange company in the illustration above). Given the low ranking, the Monte Carlo valuation yielded a lower-than-normal fair value that was 85% of the stock price. Management was accustomed to the fair value being between 110% and 125% of the stock price, so 85% was a bit of a surprise. The company uses the TSR fair value to determine how many target units to grant, so this low fair value resulted in more target units than expected. The recipients were obviously happy about this.
The fact pattern flipped for this year’s grant. The company ranked at the top of their peer group as of the grant date due to a steady increase in their stock price leading up to the grant (similar to the green company in the illustration above). In addition, like many other companies, the company’s stock price volatility had also increased substantially due to market volatility from COVID-19. (We’ll explain volatility more in the next case.)
These two factors combined to yield a fair value that was 160% of the stock price. This is among the highest we have ever seen for an award granted near the beginning of the performance period, so you can imagine the company’s shock. The company then had to explain to recipients that they would be receiving substantially fewer target units due to the Monte Carlo result, which is not the easiest conversation to have.
We’ve seen scenarios like this one too many times. The conversation quickly pivots to design changes and what can be done to mitigate extreme swings in the future. The good news is that the solution is simple (albeit with its own tradeoffs).
Aligning the performance period with the grant date rather than the start of the fiscal year eliminates realized returns, thus eliminating most fair value fluctuations. The tradeoff, of course, is that the performance period is no longer aligned to fiscal years, which may be an optics or communication challenge for participants, especially if there are other fiscal year-aligned metrics in the plan. An addition or alternative to that change would be to change your averaging window definition for your TSR calculation to occur in the first X days of the period rather than the trailing X days. What truly matters is limiting the amount of time between the start of the TSR averaging period and the grant date, and this change alone can reduce that gap by a month or more for most companies’ designs.
For those who are unfamiliar, volatility refers to the bounciness of a stock price. High volatility typically means the stock price’s daily movements are larger on average. Think of an energy company at the mercy of highly volatile crude oil prices or a small biotech firm that sees double or triple-digit movements from big announcements such as FDA approval or clinical trial updates. On the other end of the spectrum, low volatility typically means the stock price’s daily movements are smaller on average. Think of mega cap companies or low volatility industries such as consumer staples.
Higher stock price volatility generally translates into greater opportunities for the stock price to appreciate. In the stock option world of Black-Scholes, this would translate into higher value since the potential payout is much greater. However, in the relative TSR world, volatility’s effect on the Monte Carlo valuation model isn’t always obvious since there is downside as well as upside. We only know that in a high volatility world, the distribution of simulated stock prices is much wider.
The value that a TSR award delivers is driven by two factors: stock price appreciation over the course of the performance period and the payout percentage earned. This is because the Monte Carlo calculation is estimating what the award will be worth at the end of the performance period, and the fair value represents what that’s worth today. Together we call these two variables “double leverage.” Here’s an example:
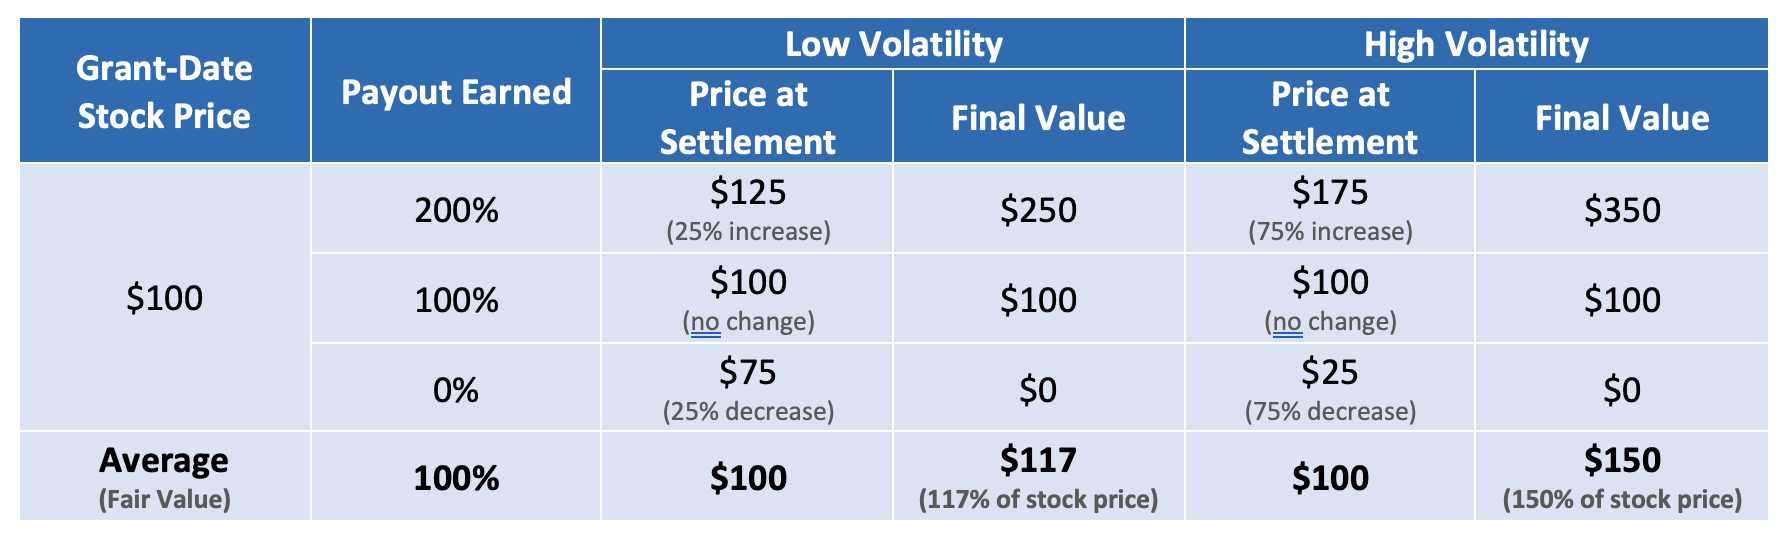
In a nutshell, high volatility amplifies the double leverage effect. On average, there will be more paths where the simulated stock price is significantly higher for a high-volatility company. Given the significant increase in price, it’s likely that the simulated payout earned was also high. When you combine these two forces, you end up with the high payout scenarios in the model more than offsetting the low payout scenarios, thereby resulting in a higher fair value.
As we mentioned, increases in volatility were very common in the 2021 granting season. We had countless conversations with clients about increases in volatility, how it impacted the fair value, and if there were any solutions to mitigate it. One case that comes to mind is a company in the restaurant industry. Their volatility more than doubled since last year because of how hard the COVID-19 crisis hit their industry. Their TSR fair value increased from 120% to almost 150%. After further modeling, we determined that volatility was the main driver.
So what can be done to mitigate this? The accounting rules provide some flexibility in the volatility calculation (e.g., using a longer lookback period) but there are no bailouts (e.g., we can’t exclude part or all of 2020 from the calculation). It’s worth noting that any changes in methodology might set a precedent for future years. While there’s some amount of flexibility that can be used responsibly, it’s important to discuss any methodology changes with auditors to avoid eleventh-hour surprises.
The last case study focuses on correlation of the peers. Correlation is an input into the Monte Carlo valuation model and it refers to how closely your stock price moves in relation to another stock price. It ranges from 1, meaning a perfect correlation, to -1, meaning a perfectly inverse correlation. If you’re right in the middle of that spectrum at 0, it means there is zero correlation.
For TSR awards, it’s ideal to have a higher correlation with your peers so that you respond to external forces (e.g., market downturns) in a similar fashion. For example, let’s say you’re an airline company and you’re about to grant your relative TSR award in January of 2020. For that award, would you rather have a peer group of other airlines (high correlation) or one including multiple industries, like tech companies (lower correlation)? We would suggest the airline group given that the high correlation means they would all be impacted similarly by a market shock (like COVID-19) and would have a similar path to recovery.
With that, let’s consider a biotech company measuring themselves against hundreds of other biotech firms in an index. We could call this an industry index, and it’s usually our preferred peer group for relative TSR awards since it balances between having a sizable number of firms to measure against and good correlations among the peers. However, for this index, this was not the case. Biotech firms are unique because they can have fairly significant stock price movements from idiosyncratic news releases, which can be random and isolated occurrences that are very specific to their research or products.
This company’s fair value was 165% of the stock price, which was a shock to all given that they implemented preventative design features to avoid extreme results (e.g., start the performance period on the grant date). After further investigation, the main drivers turned out to be an exceptional combination of low correlations and high volatility of peers. This is fairly rare, since most high TSR fair values can be explained by either realized performance or high volatility of the company.
The average correlation was just 0.30, which is very low. For industry indices, we usually see an average correlation somewhere between 0.50 and 0.80. With low correlations, this means the peers tend to move randomly, which leads to noise. The average volatility was 80%, which is very high. When you pair high volatility with low correlation, you end up with extreme performance divergence between companies in the model. This divergence means many peers often go down when you go up, leading to more frequent high modeled payouts.
The solution to an issue like this is less clear than the other issues above. For this particular company, it was too late to make any design changes, but we were able to come up with a creative solution on the correlation calculation that helped reduce the fair value. If you have more time, then you can explore design changes that can help mitigate the high value. For example, you can reconsider the peer group by analyzing alternatives based on their correlations, or you can change the payout measurement from percentile ranking (measuring versus all companies in the index) to index outperformance (measuring versus the single index value). In any event, a best practice is to estimate the fair value of the award in the months and weeks leading up to grant in order to manage expectations.
Issues like the ones we just explained are important to vet during the upfront design stage. Whether you’re planning your first TSR award or considering design changes, modeling any proposed changes across many performance scenarios will help you avoid negative surprises. This will either lead to design changes that help insulate the award from extreme swings or it will set expectations that swings are possible. Either way, the company will be better off.
If you’ve fallen victim to high TSR fair values or extreme swings and haven’t talked about how to fix it, then it’s not too late for next year’s grant. As we head into the summer months, we approach design and planning season for many of our clients. Here are a few things that could be interesting to look into:
This is a perfect time to start thinking about next year’s design and any changes that might be needed to avoid future fire drills. We’re always happy to chat about these issues, even if informally. Feel free to reach out to us if you have any questions about the topics discussed here or if it would be helpful to talk live.
